You can carry out visual analyses of a created model with all the display options of the Standard User Interface of the SubsurfaceViewer. You can find a lot of details in the Wiki in the blue navigation bar under "Object functions". Each object can be visualised in different ways via its Settings.
In this section we will explain small additional options that typically occur in the application of the models.
¶ Synthetic Drilling/Drilling Planning
Synthetic boreholes can be created within the model area. These can be selected in the 2D map as well as in the 3D map with this tool  Synthetic log. The tool is selected and you click in the map or model at the position where you need a synthetic hole. A red triangle appears in the 2D map at this position and a window opens with text fields containing the coordinates. Here you can also enter the coordinates manually.

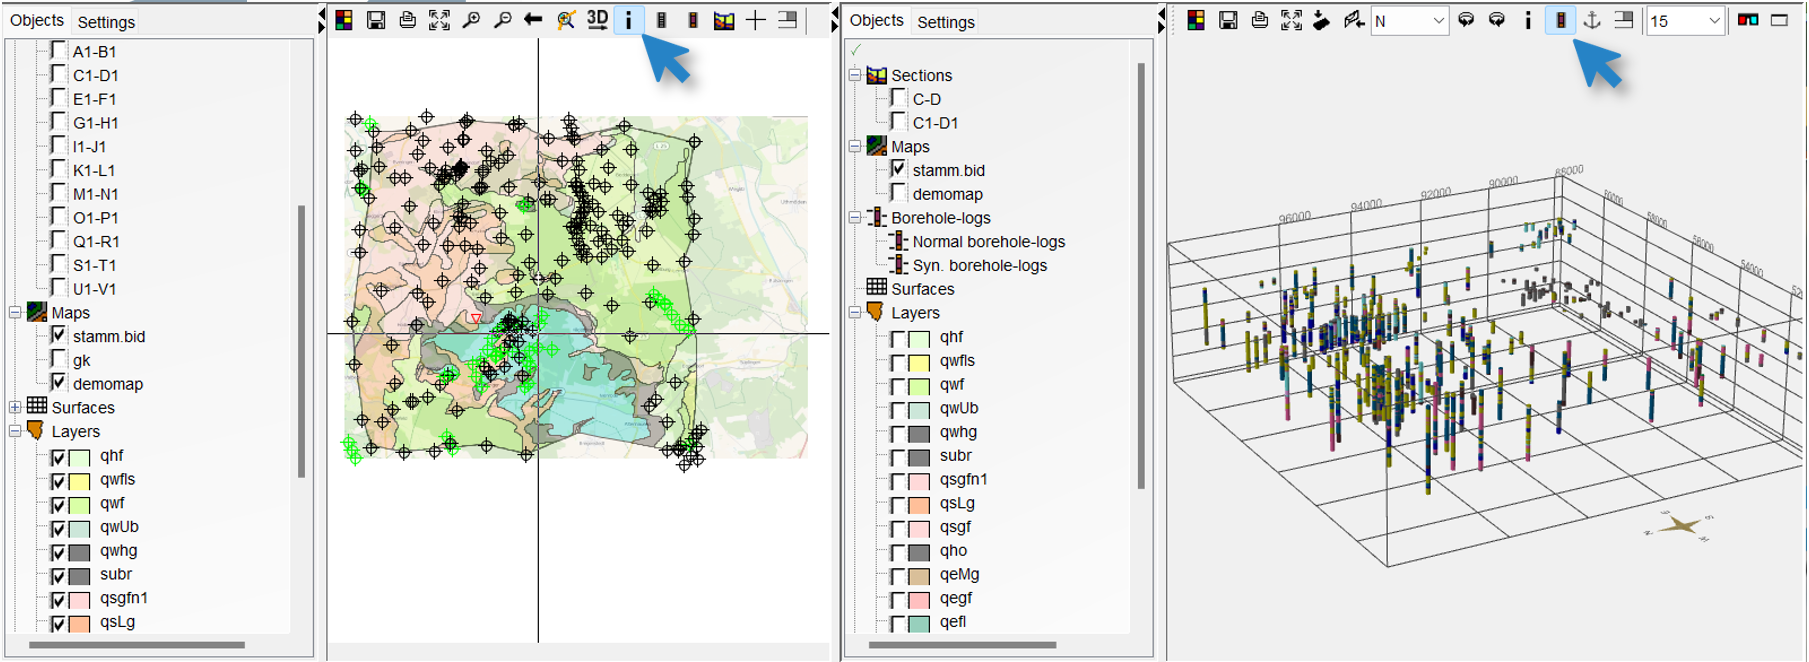
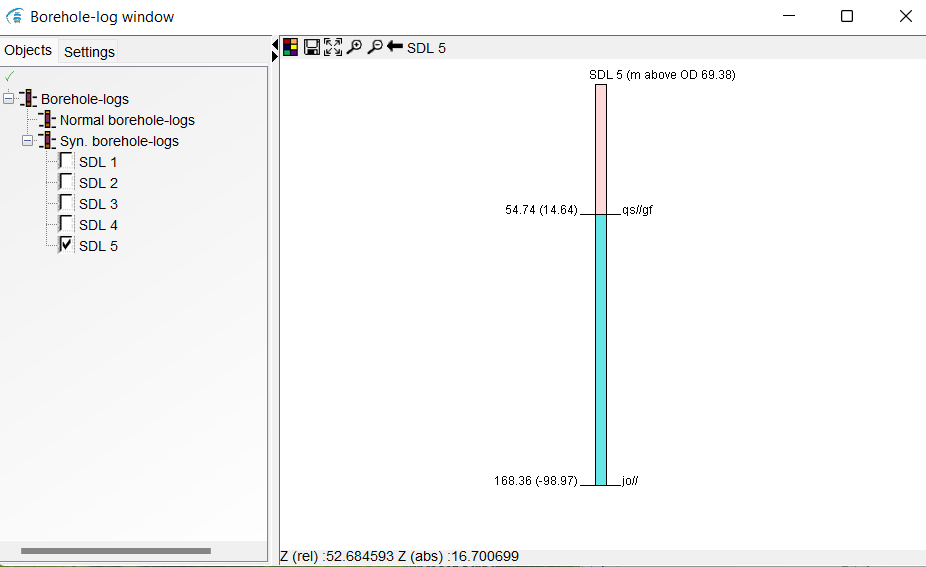
The synthetic boreholes are sorted in the Borehole-log window under Syn. borehole-logs. With the  -symbol you can save the information of the synthetic borehole as text.
The synthetic borehole in the image has two different layers (qs//gf and jo//) at the location, the names of which are displayed at the bottom edges of the layers on the right side of the column by default. The colours and assignments can be found in the legend. The information on the relative and absolute depth of the layers is on the left side in the standard setting. The information in the lower part of the image shows the z-coordinate and the relative and absolute depth at the position of the mouse cursor. Read the articles Borehole-log window and Boreholes for more information about setting options.
If you want to see a synthetic borehole through a voxel model, you need to select the name of the voxel model as a column option in the Settings for Boreholes. You will see the column with the colour distribution that corresponds to the voxel values at the corresponding coordinate. If you want to have more than just a visual impression of it, you can use the function Extraction at XY from voxel model. Then you will get the vertical voxel values as a table at your XY positions.
¶ Create cross section
With the cross-section tool  in the upper toolbar of the 2D-Map view a synthetic cross-section (or profile section) can be drawn through the model. The cross-section is displayed synchronously in the cross-section view. To create a cross-section, the following steps must be followed:
- Click on
 .
. - Select the starting point of the cross-section in the map.
- Select second point in the map -> points are connected.
- To add further sections, another point must be selected.
- The end point is set with a double click at the selected point.
- The lines turn red and another profile section can be seen under sections. When creating a new cross-section, the old one in the 2D-View is coloured black and the new one red.
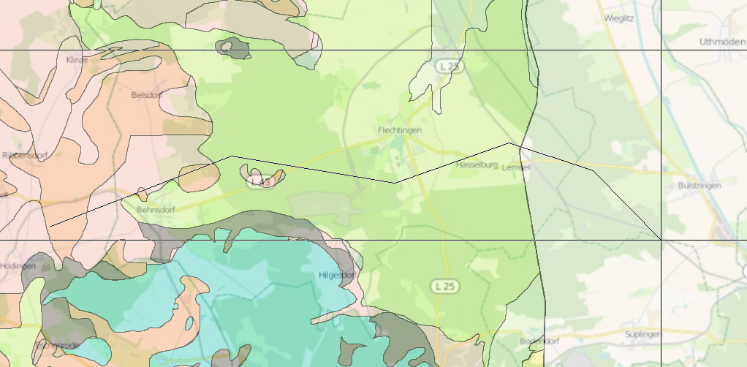
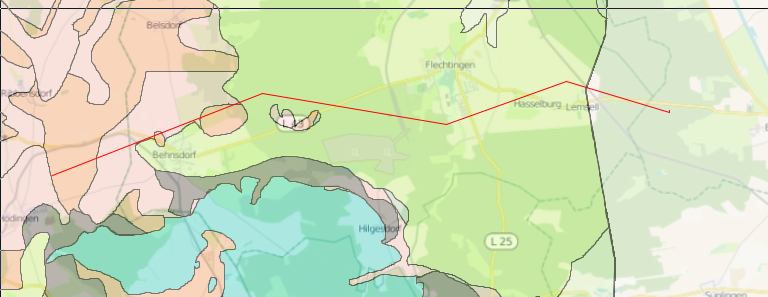
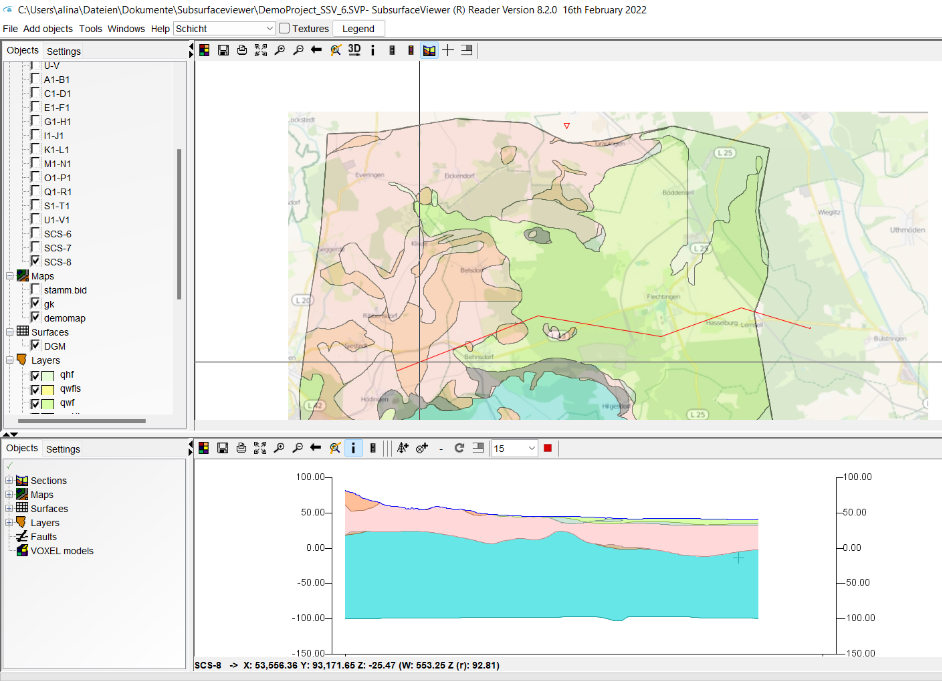
The finished cross-section is displayed in the cross-section view. If you move the mouse along the cross-section in this window, the cross moves with it on the map. If you want to see the synchronised cross also in the 3D view, you have to set it with the Settings(Cross). Also have a look at the Settings of the cross-section view for more options for this synthetic profile cut.
Note:
To be able to view the cross-section in the 3D model, the cross-section must be selected in the left tab Sections of the Cross-Section View with a right click and Link to 3D view. The cross-section appears in the 3D view under Sections.