Important note:
The SubsurfaceViewer expects a Cartesian coordinate system for all imported objects. In this case, up is regarded as north. Thus, there are no options for transformations to and from different coordinate systems, as you are used to from geoinformation systems (e.g. QGIS). So need to transform the data into a uniform Cartesian (for example UTM) coordinate system with a GIS system, to use it for modelling with SubsurfaceViewer.
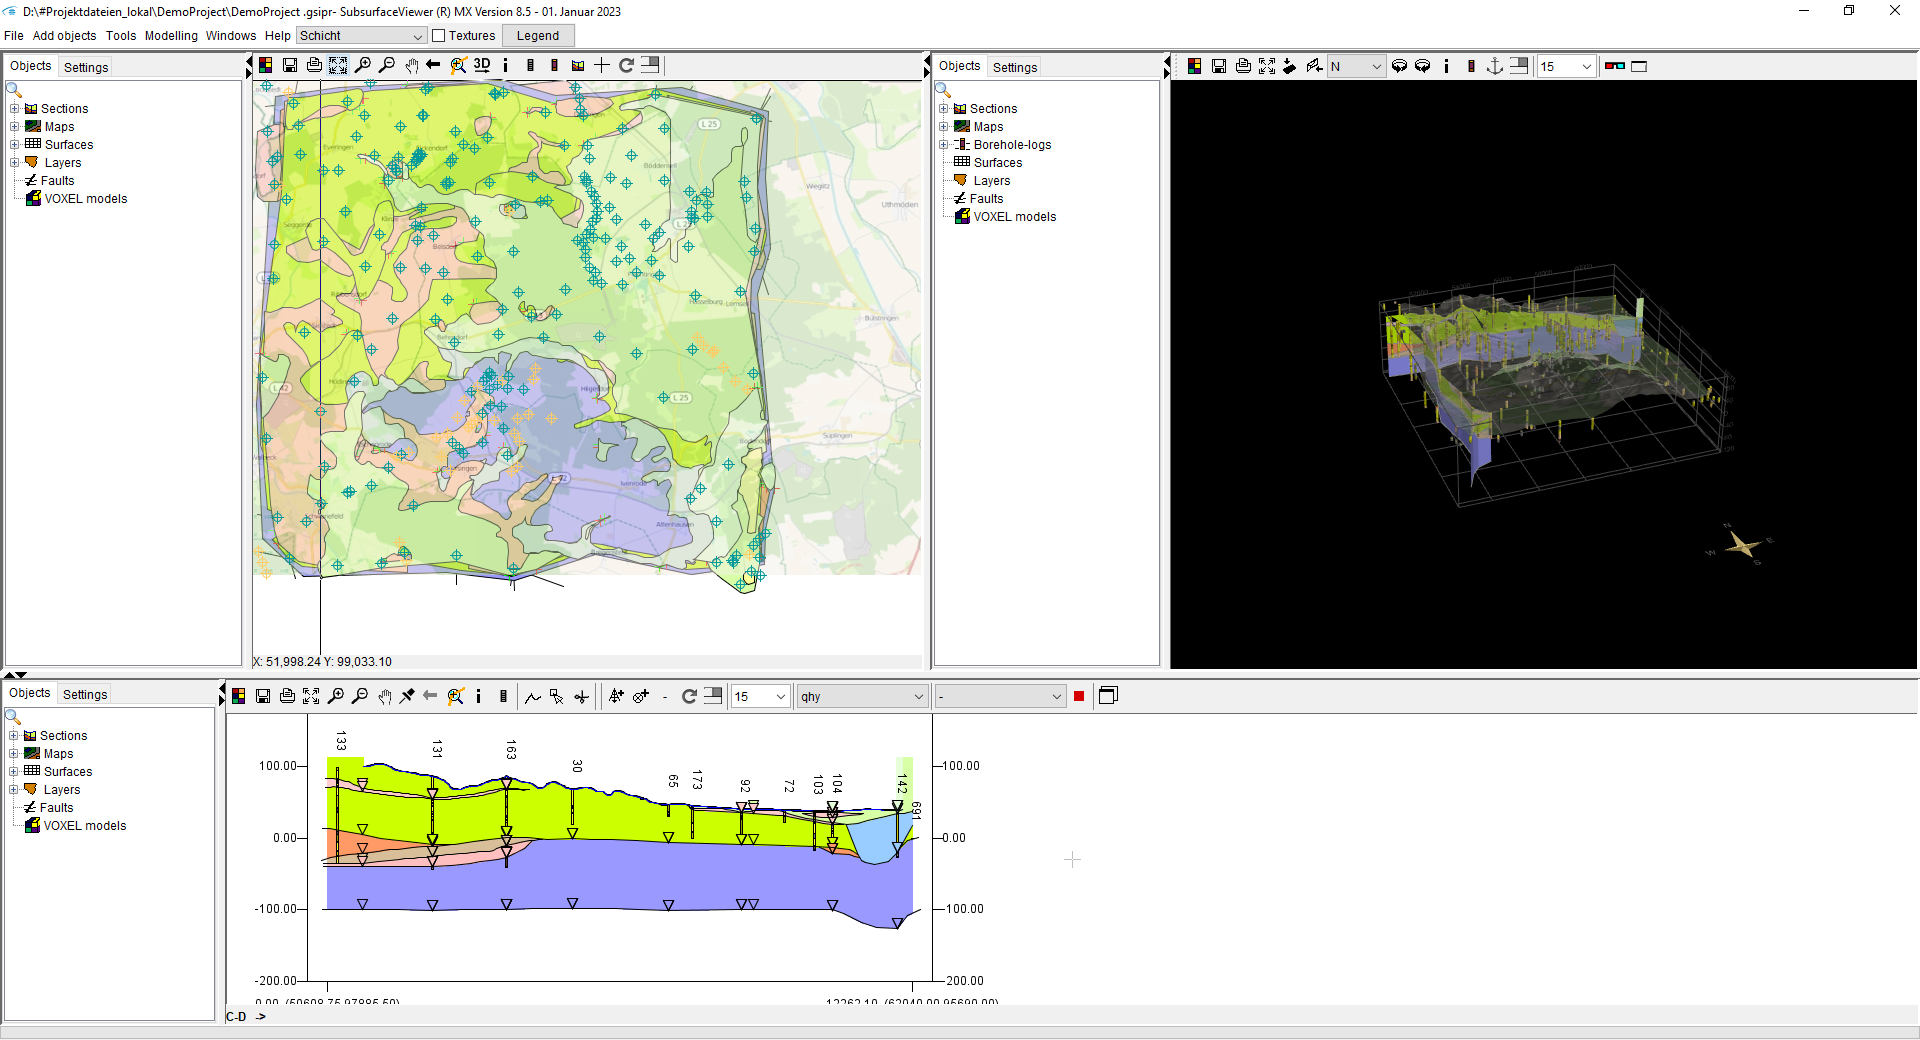
In the following pictures the opened model is shown:
(see Program Settings)

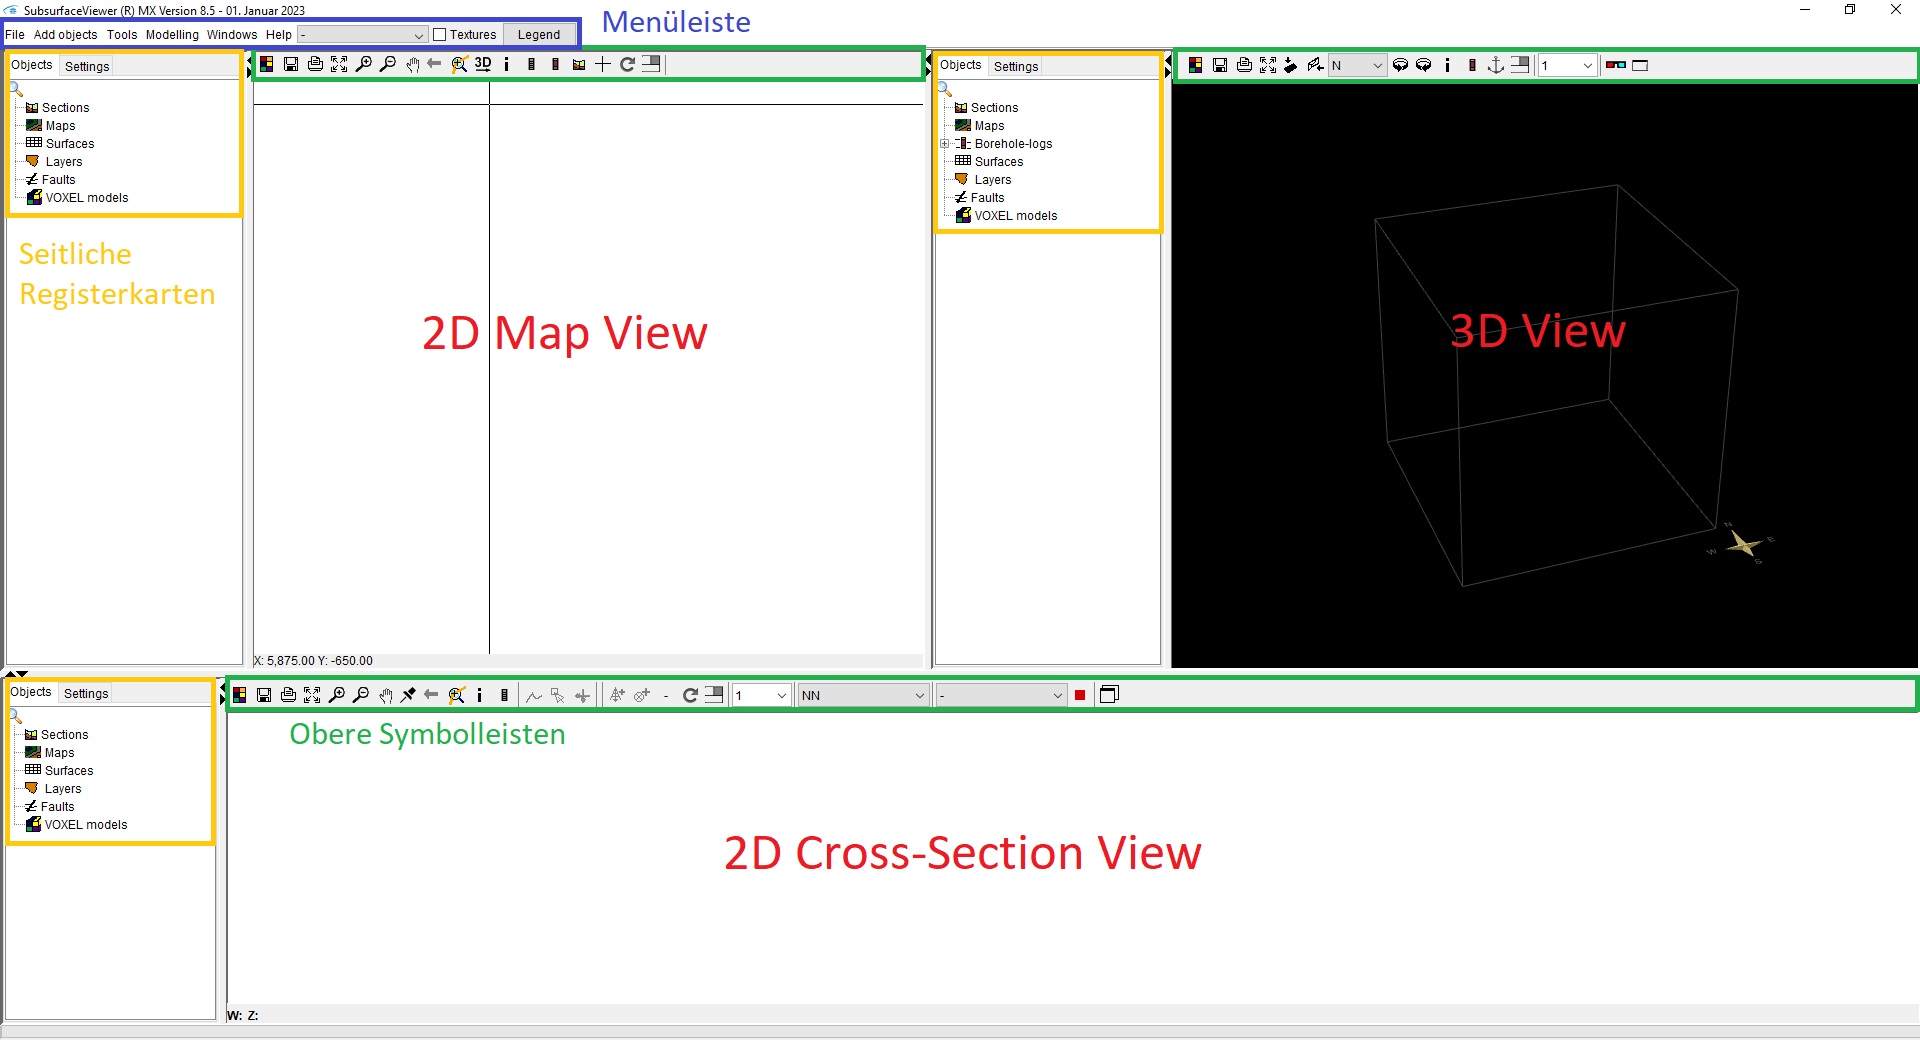
In each view is a bar for layers and model layers on the left side. At the top is a toolbar:

| User Interface | → | Graphical view of the programme and interface to users |
| Menu bar | → | Control element, which is opened by clicking and offers various options and functions |
| Tab | → | control element in the user interface that allows several tab sheets to be displayed |
| Toolbar | → | control element as a horizontal bar with individual buttons |
| Button | → | key, symbol or tool, control element with which users can trigger a function |
¶ 2D-Map View
At the top left, the window shows a map view in 2D. Locations can be selected by clicking. The coordinates and point information are displayed at the bottom left (e.g. a terrain height if a height grid is loaded or the designation of a polygon from a Shape\ file). In the left tab you can include or remove objects in the 3D view with a right click (Link to 3D View). Read the following section Objects. In the 2D Map View it is possible to locate specific points, select real and synthetic boundary points and select synthetic and real boundary segments. Read more about it at Visual Analysis.
¶ 3D-View
The 3D view of the model is on the right-hand side. You can access all the information that was set via the 2D map view. Many viewpoints and multiple perspectives are available. You can take model screenshots and record movies using Video recording.
¶ 2D-Cross-Section View
The 2D Cross-Section View in the lower part of the screen displays the subsurface layers in 2D and depends on the cross-section selected in the model. The information of layer top and bottom edges can be retrieved and drill points can be displayed as voxel models. You can make the layer constructions here. The cross-section can be shown in the 3D-view. All further functions and more about the information to be retrieved can be found under Construct cross-sections.
Note:
The two arrows at the top can be used to open and close individual windows.
¶ Menu bar

In the menu bar, you find higher-level functions, make programme settings and open windows or settings that will become important in the further course of the application.
This chapter describes the first steps after the project has been set up. For more detailed information, navigate in this wiki on the blue bar on the right to the category "Main menu".
Under File you can find all important settings of the programme, saving and loading options as well as imports and exports.
The menu items and functions Tools, Add objects and Windows become relevant if you want to extend the model, add objects, make an analysis or see the legend with further background data Windows.
The last menu item Help passes you to this wiki and you can call up the information of the SuburfaceViewer under about SubsurfaceViewer ® MX. You get information about the version number of the programme, imprint, 32-bit or a 64-bit version, as well as the available and occupied memory.
The dropdown list next to it is filled as soon as you have created and loaded a GVS file. It contains several entries if you have created several columns in the GVS table that assign a meaning or property to the geological units. If you create your project legend accordingly and you change the entry in the dropdown list, the colouring of your model is switched ad hoc according to these properties.
If you have created paths for textures in the project legend, you can activate the Textures checkbox. All geological layers, as well as layer descriptions in boreholes with the same coding, are displayed in the 2D-, 3D- and Cross-Section-View with textures. You can see a pictorial example here.
When using the button Legend, the Legend Window opens.
¶ Side tab

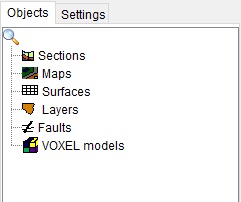
The side tab provides an overview of the geological objects and a variety of settings and functions. For more information, see Objects/Settings.
¶ Top toolbar

In each of the three views a toolbar can be found, which basically contains the same functions such as changing colours, zooming, drilling points or cross-sections. The toolbars of the 2D and 3D views differ, the specific functions are explained in more detail under Toolbars.