You can load boreholes via the Main menu bar - Add objects. Follow the instructions and links to the formats there.
Bores in SubsurfaceViewer are vertical logs, as this has been completely sufficient for our circle of users so far. Logs with deflection and skew or horizontal course cannot be displayed via this function. How you could achieve this with tricks and manual work as well as a few compromises, we have linked here. Feel free contact us if you think the functionalities should be expanded for our further developments.
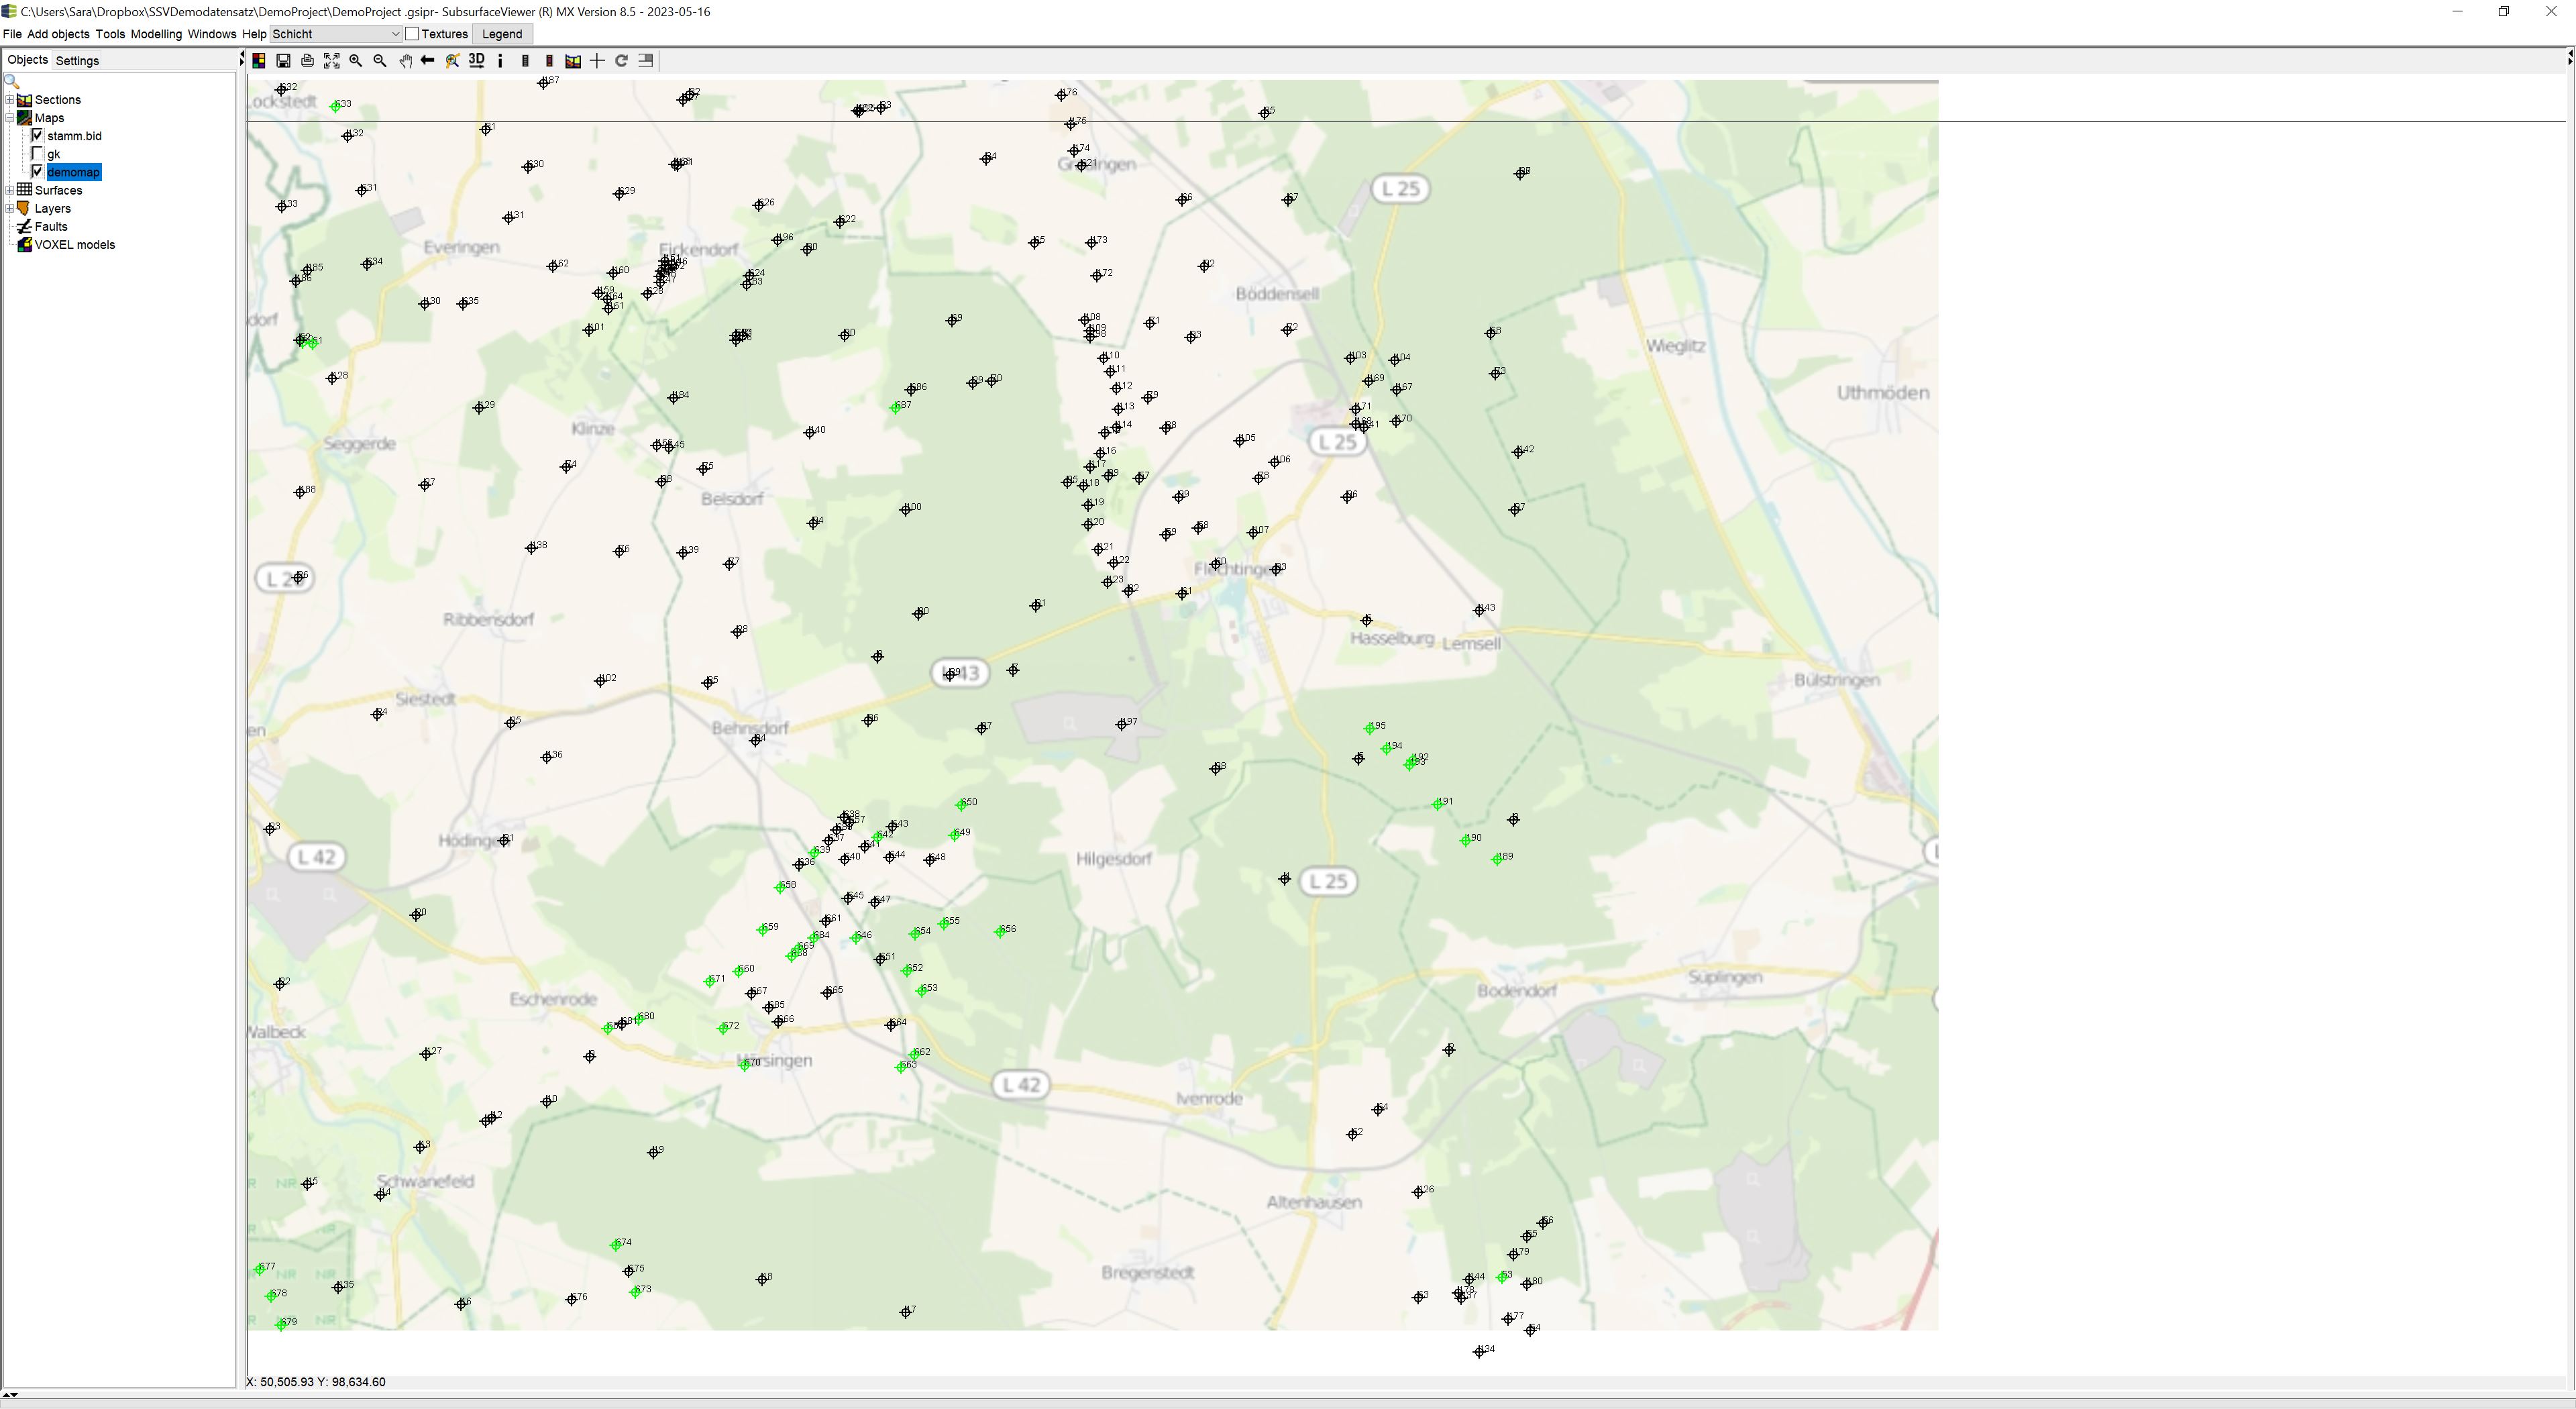
The boreholes loaded via the standard user interface of SubsurfaceViewer are each equipped with a borehole point map and the respective borehole layer information. In the object tree of the 2D-View you will find them under the title of the loaded *.bid master file in the category Maps. The locations are immediately shown on the map with the  symbol in different standard colours. If boreholes without layer descriptions are present, they are red. Boreholes that penetrate depths greater than 10 metres are shown in black and shallow boreholes in green. You can change these settings later, which we explain below.
If you move the mouse over a borehole point in the 2D-View, the name of the borehole is displayed in the text bar below the view. The names of the boreholes can appear as labels in the 2D map. Follow the descriptions in this article.
If you click on a borehole point with the Info button of the 2D View toolbar, the Borehole-log window opens by default. Read the linked articles if necessary.
With a right click on the name of the drill point object in the object tree of the 2D-View, a context menu opens. In this article, only the options specifically tailored for this object and the Settings are described. Explanations of all other entries can be found here.
¶ Center borehole in 2D-view
With this function you focus the 2D view on the drilling point you are looking for. Enter the name of the borehole in the pop-up window that opens and press OK. If the bore point with the entered name is not found, nothing happens. If the borehole was found, the 2D view centres on the borehole point in the active scale and a red triangle marks the position. If you zoom in (e.g. with the mouse wheel) the centre of the view remains focused on this point.
¶ DTM Z correction
This function determines the boreholes for which there are deviations in the drilling approach heights from the *.bid master file and the active digital terrain model.
A pop-up window opens where you can enter a tolerance for the deviation in metres. An entry of 0 means that you expect the drill approach heights in the master file to be exactly the same as those in the active DTM. An entry of 0.5 would mean that boreholes with height deviations of less than 0.5 metres are not listed in the output.
The boreholes with deviations are saved in a *.ebid-table with the following structure:
In the first four columns is the master data of the drillings. Then the heights of the active DTM are listed at the drill point coordinate. The following column contains the heights as read from the master file and the last column shows the deviations of the two preceding columns. If you load this ebid-table either as a *.bid-table, you can see the deviations as a label in a map. You can load this table into the Parameter Manager for an advanced analysis. Read about your options there.
¶ Export borehole master data
Here you can export a master file from loaded drill point objects again as a *.bid table. This makes sense if you have sent your project file to third parties exclusively via a GSIPR or an SVP file. This way third partues have the possibility to save the master data you used separately in a separate file.
¶ Export extended claim data
Equivalent to Export borehole master data you can extract loaded *.ebid-tables from a project file and store them separately.
¶ Settings
With the Settings you open options for the display of the bore contents.
You will initially see a dialogue with general visual settings.
¶ General
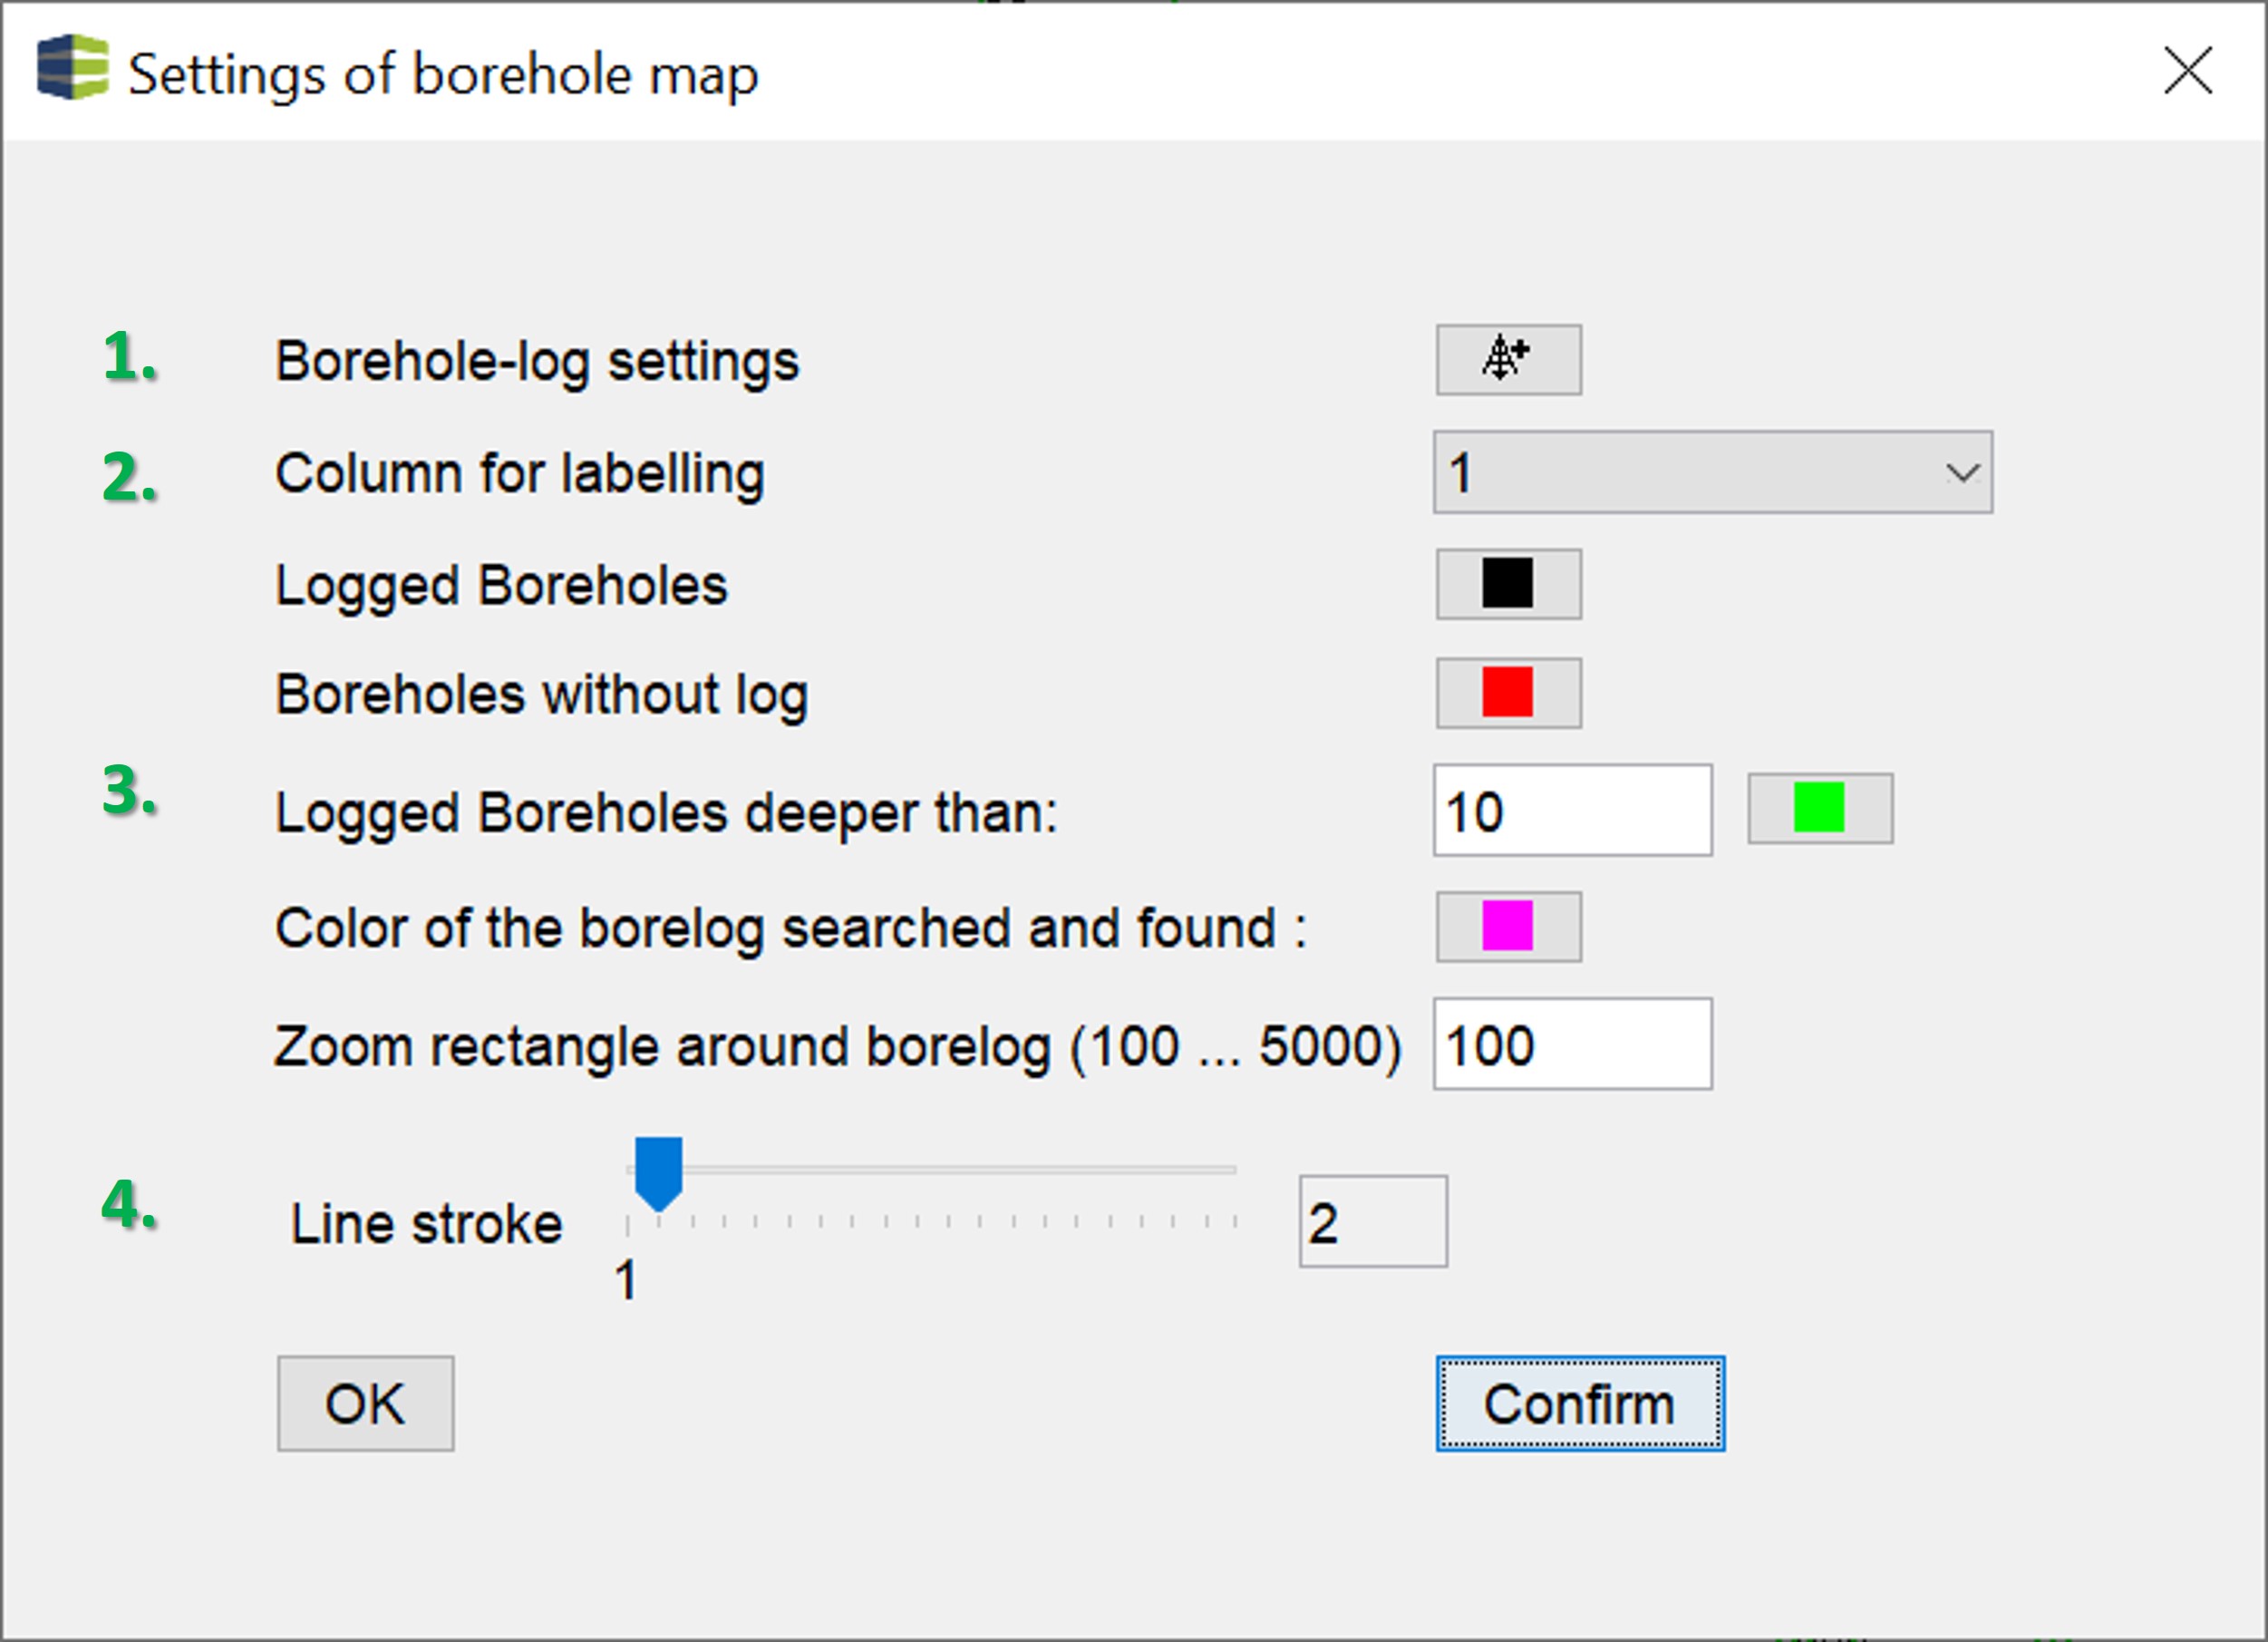
- The button at Borehole-log settings opens another dialogue, which is described further below.
- With Column for labelling you select from the Dropdown-list the column in the *.bid-table or *.ebid-table which appears as a display of the borehole name on the borehole point map. How to activate labels on boreholes for the 2D view of the borehole point map is described here. The selection of the column has no influence on the focus to a borehole by borehole name or the display in the information bar when using the
 -button of the toolbar.
 - In the following fields you set the conditions for the colouring of the boreholes on the borehole map. Logged boreholes* are boreholes for which layer descriptions can be found in the system in *.blg-files. Accordingly, Boreholes without log are boreholes without layer descriptions. For Logged Boreholes deeper than you put a depth in metres into the text field from which a borehole should be marked as a deep borehole. These are given a different colouring than the shallow boreholes. This is especially advantageous for the profile section construction, as you may want to prefer deep boreholes for an embedment. At Color of the borelog searched and found you set the marker colour for borelogs that you have searched for and found using the search tool. The drill holes are marked with a rectangle in this colour. You define the rectangle size with the input Zoom rectangle around borelog (100 ... 5000) with values between 100 and 5000.
- Adjust the line width of the drill point map individually with the slider at Line stroke. It is recommended to increase the line stroke especially if you are working on UHD screens.
¶ Borehole-log settings
Open the Borehole-log settings via the icon ![]() .
.
Note: You will find this icon in the settings for the Profile Section Views and the settings of the Borehole-log window. The window that opens is always the same, except that they apply separately to the respective views. If you open this window via the Settings of the borehole map, these settings apply as default for the Borehole-log window at the initial view and when transferring the borehole map to the 3D-View.
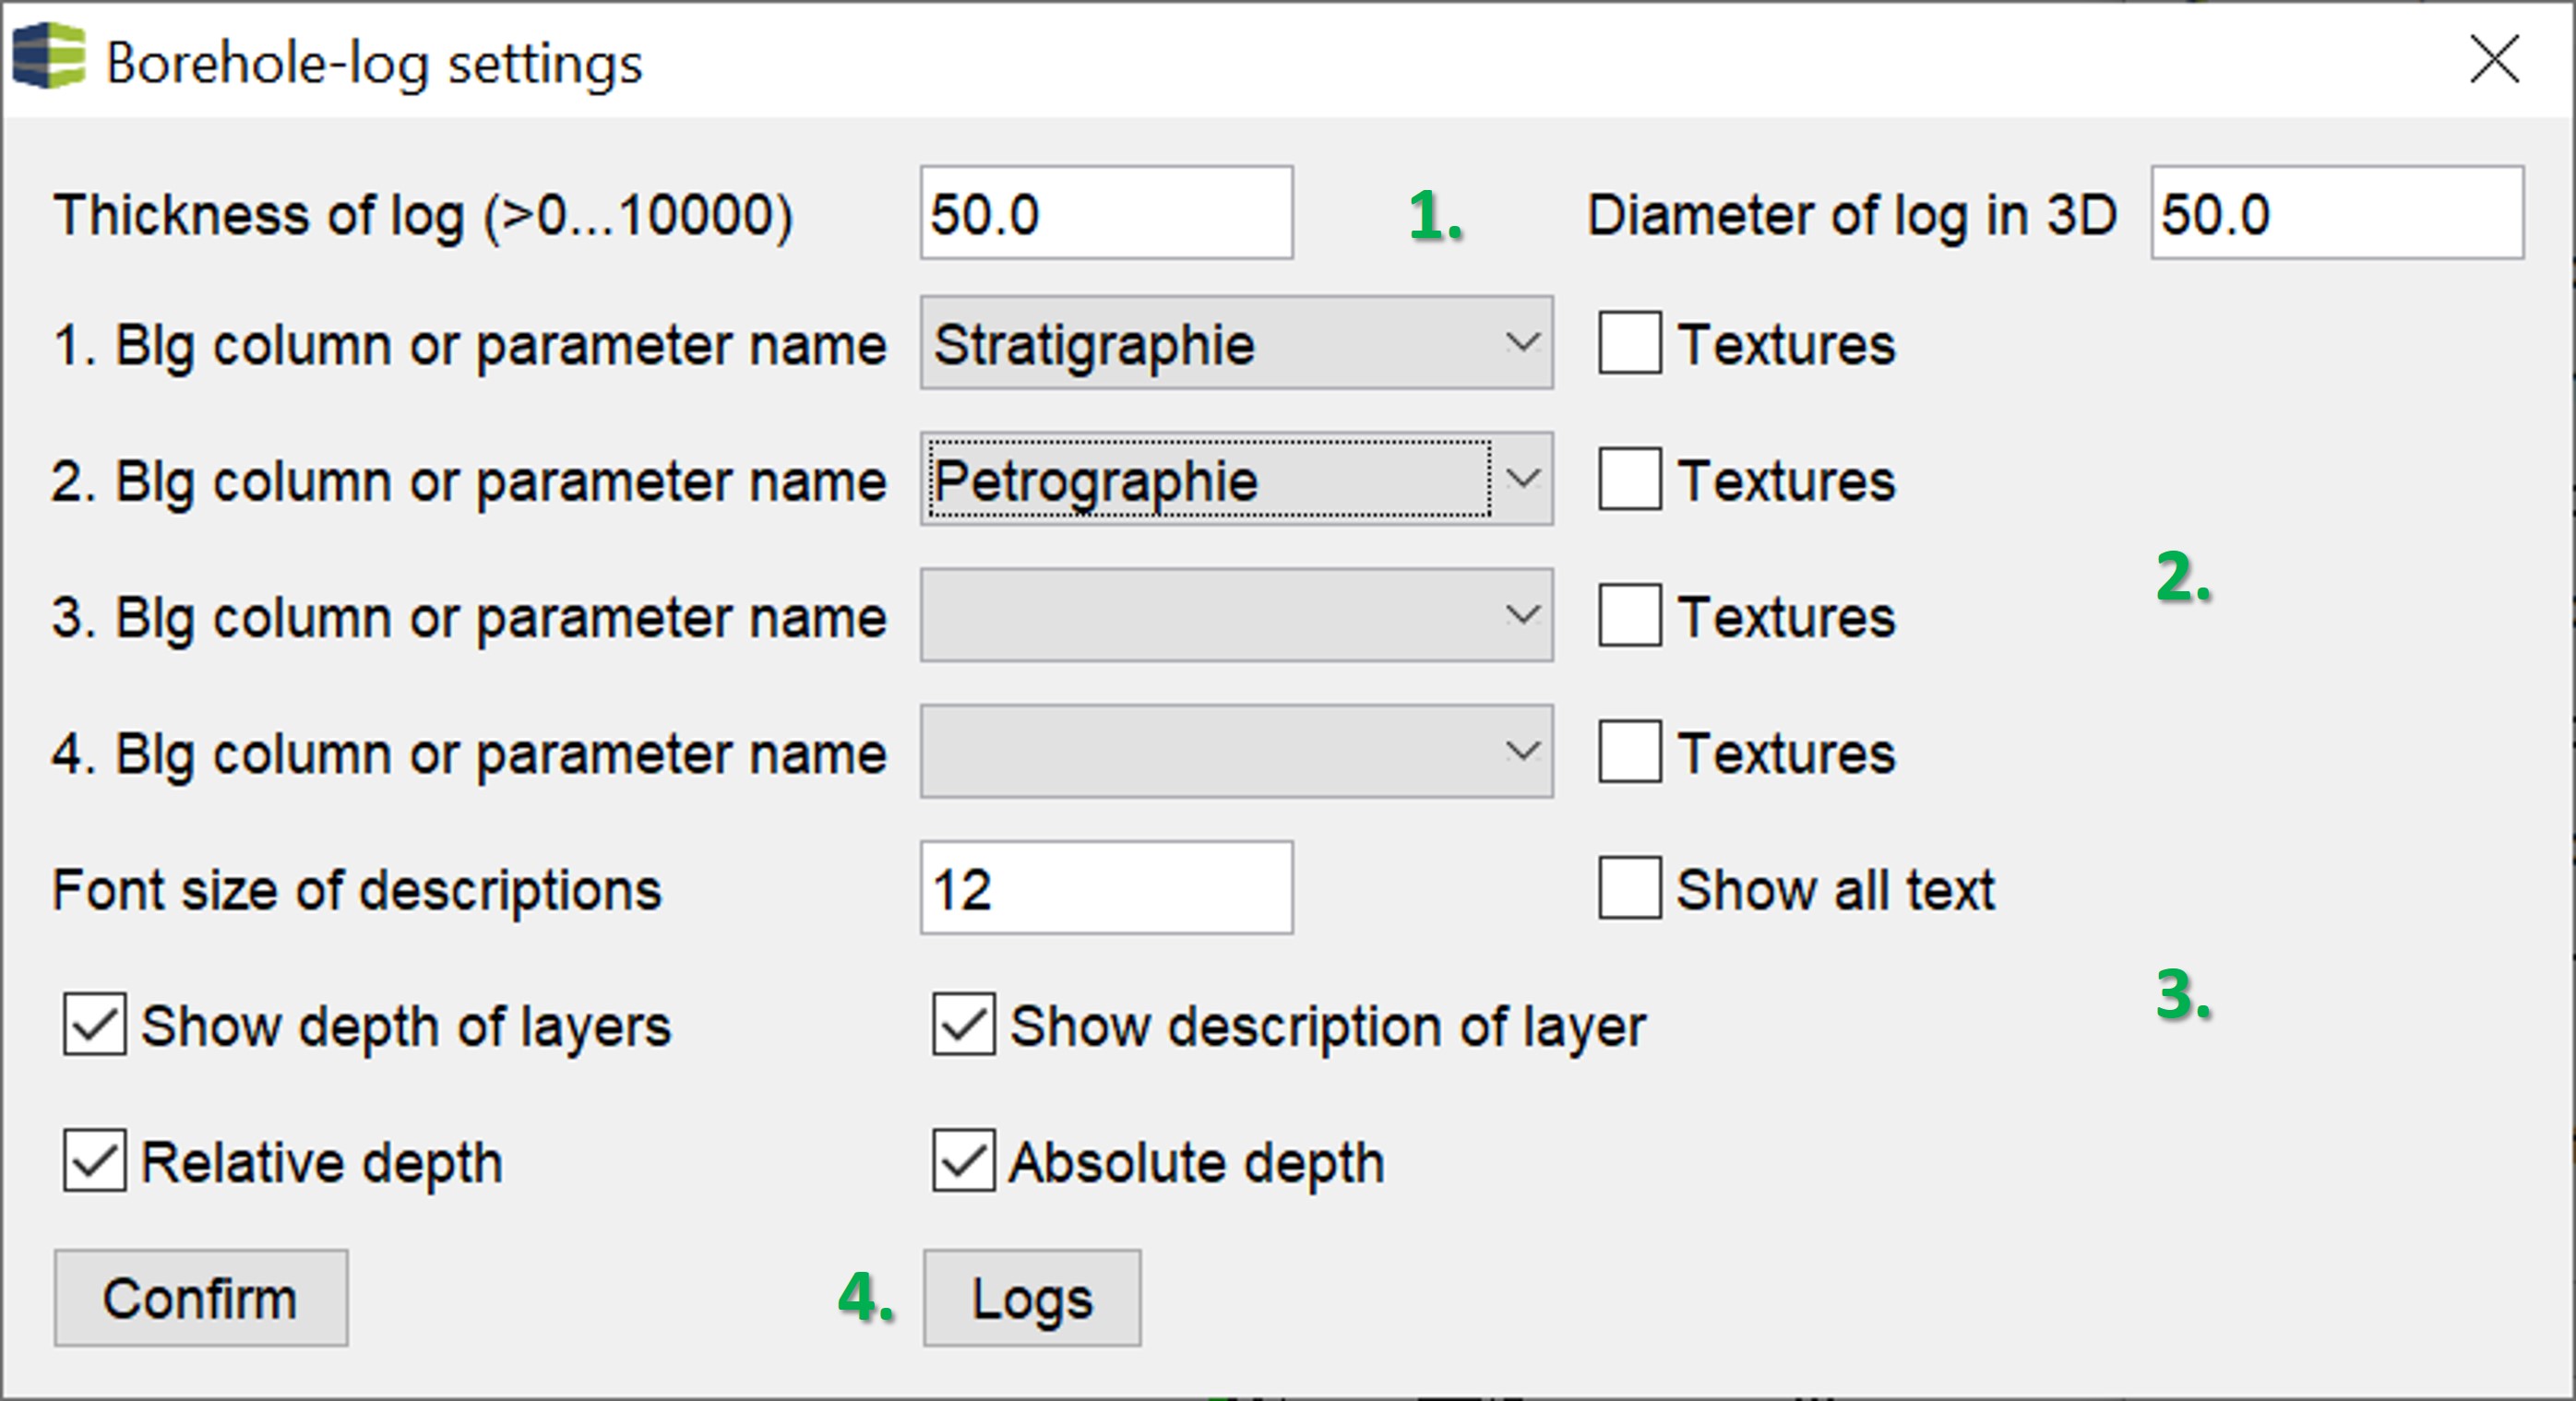
- Enter the width of the displayed drill columns in 2D with Thickness of log (>0...10000) and in 3D with Diameter of log in 3D in meter in the first row.
- Rows 1-4 define which parameters from the *.blg-file should be visible on the drill columns with colouring, text and textures. Use the Dropdown list and the corresponding check mark for Textures for it. If one parameter is selected, the full width of the drill column is displayed with this parameter. If several rows are filled, the width of the drill column is divided accordingly. The Dropdown list is not only filled with the column names of the layer description. If you have also loaded a *.plg-file, the parameter names will be integrated here. The plg data are not visualised in the 3D-View. If you want to see measured parameters in certain depth intervals in the 3D-View, create a LocView-Object with the Parameter Manager. If you are working with synthetic boreholes, you can find the names of the model sources (layer, voxel) in the dropdown list.
- In the lower section you can see the settings for the texts that are displayed on the drill column. At Font size of descriptions you set the font size. The check mark Show all text enables the entire layer description for viewing, regardless of which parameters you have selected under 2. The texts from the columns are listed horizontally, ,-separated. A tick at Show depth of layers activates the view of the depths as Relative depth -> depth and Absolute depth -> absolute height (e.g. NN). If you deactivate the check mark at Show description of layer, no layer description is shown as text. You will see the coloured drill columns with the depth information, if selected.
- With Logs you have extended functions to display numerical curves from LAS-files of geophysical borehole measurements at the boreholes in the section. Another dialogue will open here.
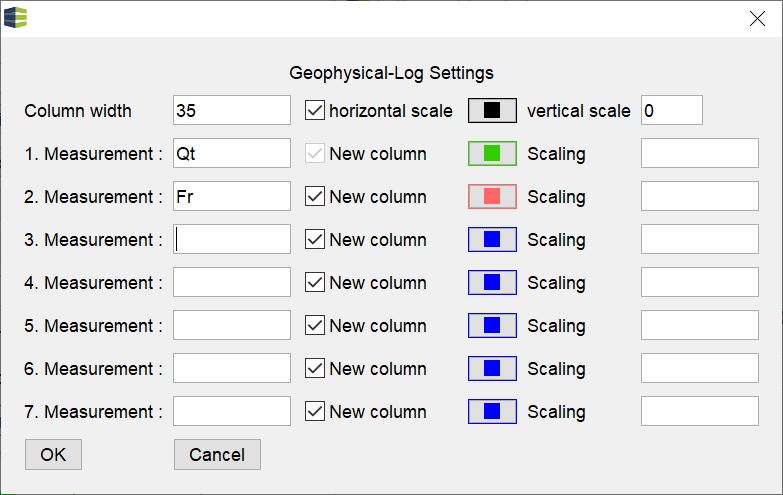
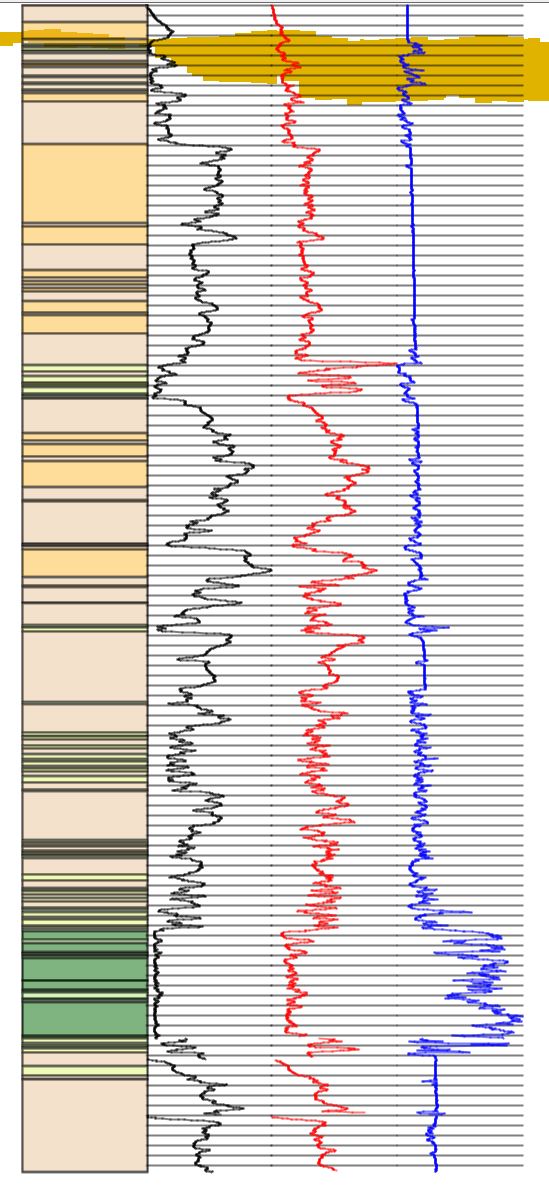 Enter the width of the displayed curves in metres in the section at Column width in the first row. If you want to see auxiliary lines for the orientation of the depth horizons, set the check mark at horizontal scale active and enter the number of auxiliary lines (>0) at vertical scale. The colour button to the left determines the colour of the auxiliary lines.
Below this, define the names of the data to be read from the LAS files. If you tick New column, the curves will be displayed one after the other, as you can see in the example. If you uncheck the box, the curves are plotted on top of each other, normalised to the width. Note that you only get a relative impression of the curves. You cannot directly see the absolute numbers that belong to the curves. If you wish to do so, you should consider using the LogExplorer.
- Confirm your settings and the window closes. You may need to refresh your section views to see the result.