Create a TIN in the Main Menu Bar under Add objects -> Triangle mesh (TIN).
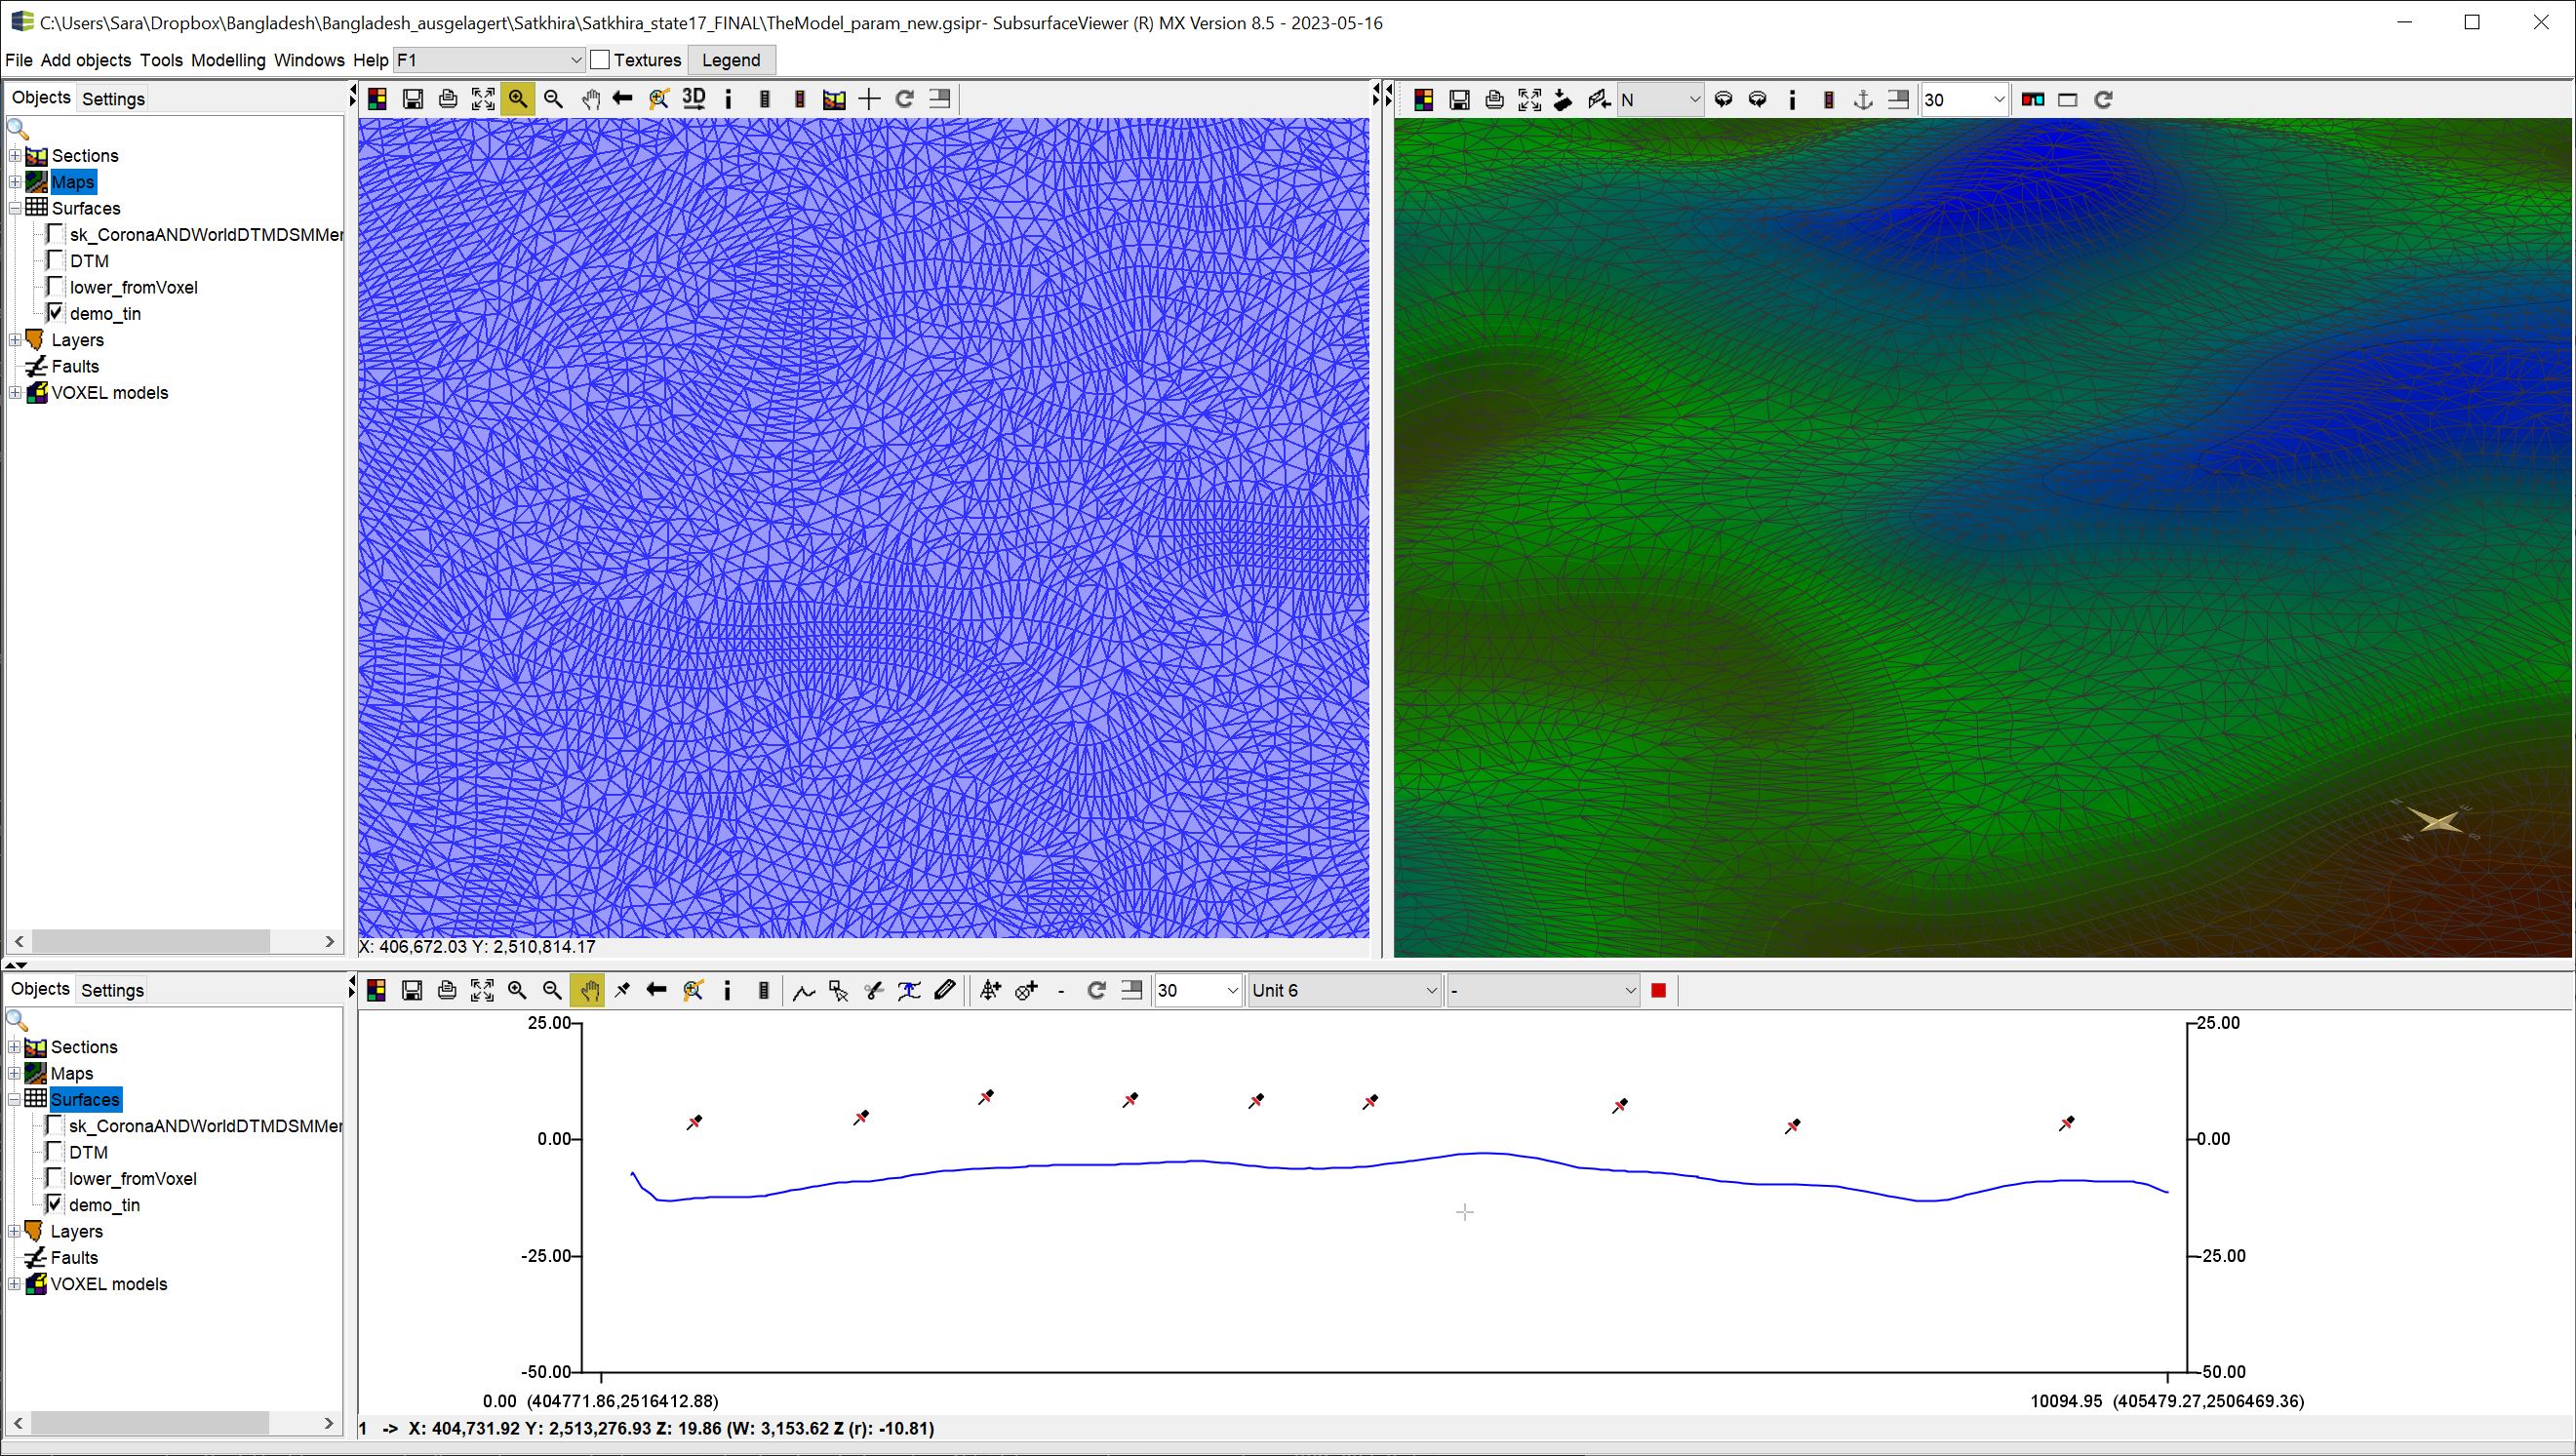
A TIN is a triangular mesh. It always contains a border polygon in the SubsurfaceViewer.
Note: The triangle mesh is calculated in SubsurfaceViewer with the Delaunay method.
If you have triggered the loading of a TIN object, a small pop-up window appears where you define and confirm the name of the object.
The TIN object appears in the 2D object tree under the category Surfaces.
¶ Create triangulation
You can calculate TINs by loading XYZ data from different formats. You would need to use the right click context menu to do this and the Extra functions submenu.
Note:
Before creating a TIN object, you must consider entering the minimum point spacing, which is set in the project settings. Points with distances below this minimum are ignored during the interpolation. This ensures that the triangles do not become disproportionately small at some points in the model.
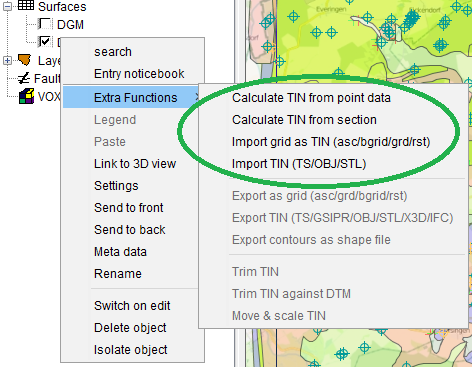
- With Calculate TIN from point data, a TIN surface can be calculated from various file formats with XYZ-point data.
- With Calculate TIN from section, surfaces can be modelled from layer bottom edges/lines that are used for interpolation within Profile Sections. The vertices (nodes) of the constructed lines are used as input for triangulation. The lines must have the same name in each constructed profile section, which is selected in the field Line name in sections. Subsequently, each line vertex in these sections is used to calculate a TIN object from them.
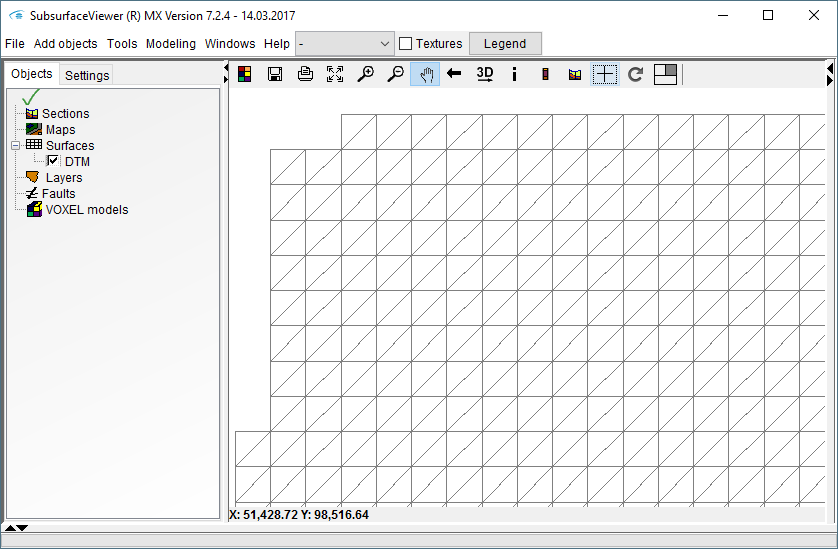
- With Import grid as TIN the information from Grid files is loaded into the TIN object. For the conversion of this uniform raster data, two triangles are formed for each cell of a grid. For this, the built-in algorithm has two options - left lower and right upper triangle or left upper and right lower triangle. Therefore, the transformation is not unique. The following figure shows the scheme of the second option.
- With Import TIN, TIN surfaces or shells can be loaded that were created in another software, for example in GOCAD.
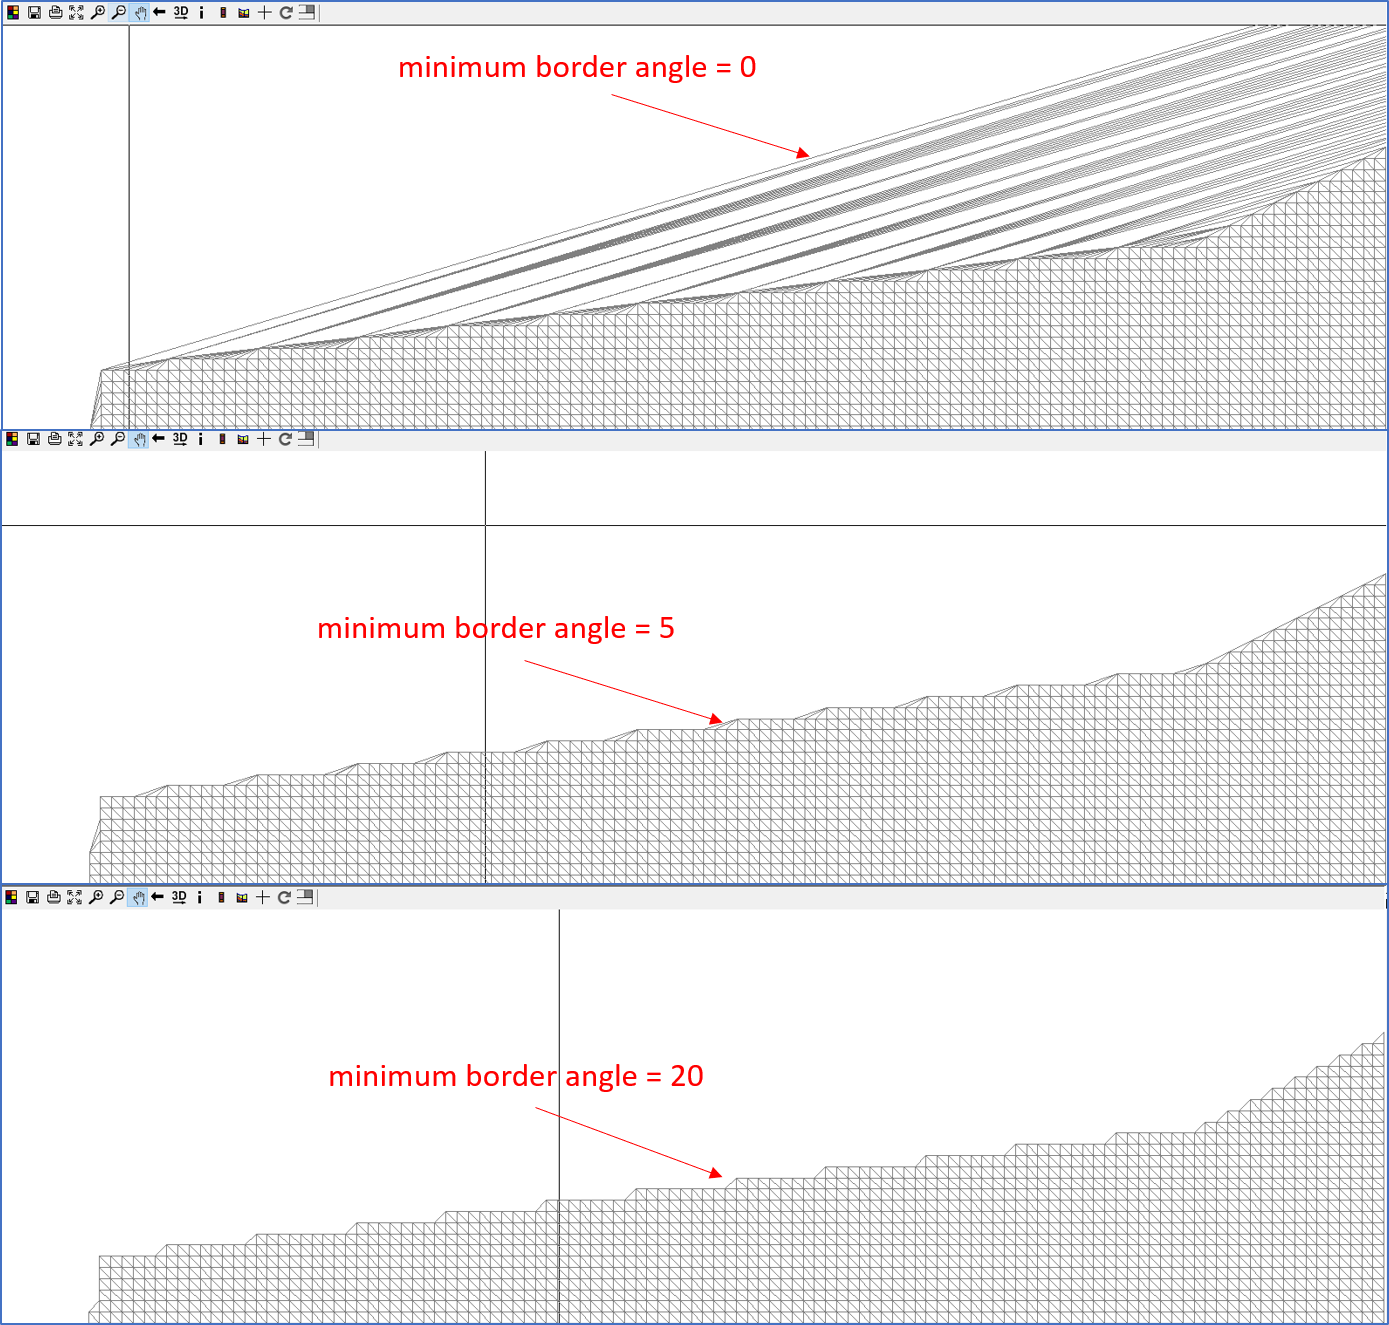
In addition to the options for Smoothing and Refining, a minimum border angle can be entered. When elevation data is available with an irregular envelope, it can be helpful to assign this minimum border angle. By default it is set to zero and can be changed from 0 to 44.99 degrees. The effect of the selected boundary angle is very strong in some cases, especially if the point envelope is irregular or meandering. In the following figure, a regular DTM XYZ file was used for triangulation, where the edge is not square. The edge angle dominates the surface edges considerably.
Note: You can create a TIN from a Geometry2D object. Use the function Create TIN from the context menu of the Geometry2D object.
¶ Smoothing und Refinement
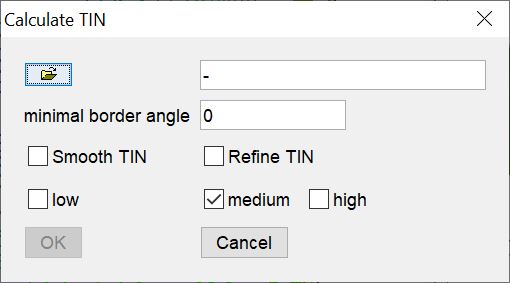
After an initial triangulation via the loaded height points, the resulting triangles are subdivided.
During refinement the centres of the triangles are calculated and added back to the original point data set. A triangulation is created again from the increased point data set. Depending on whether you have defined low, medium or high for the refinement, this number of repetition of the varies. With high, small triangles can be created. If the triangle edges are too small in the result, no further subdivision takes place.
For smoothing, the Clough-Tocher algorithm is used. Here, you determine the degree of triangle subdivision with the settings low, medium, high.
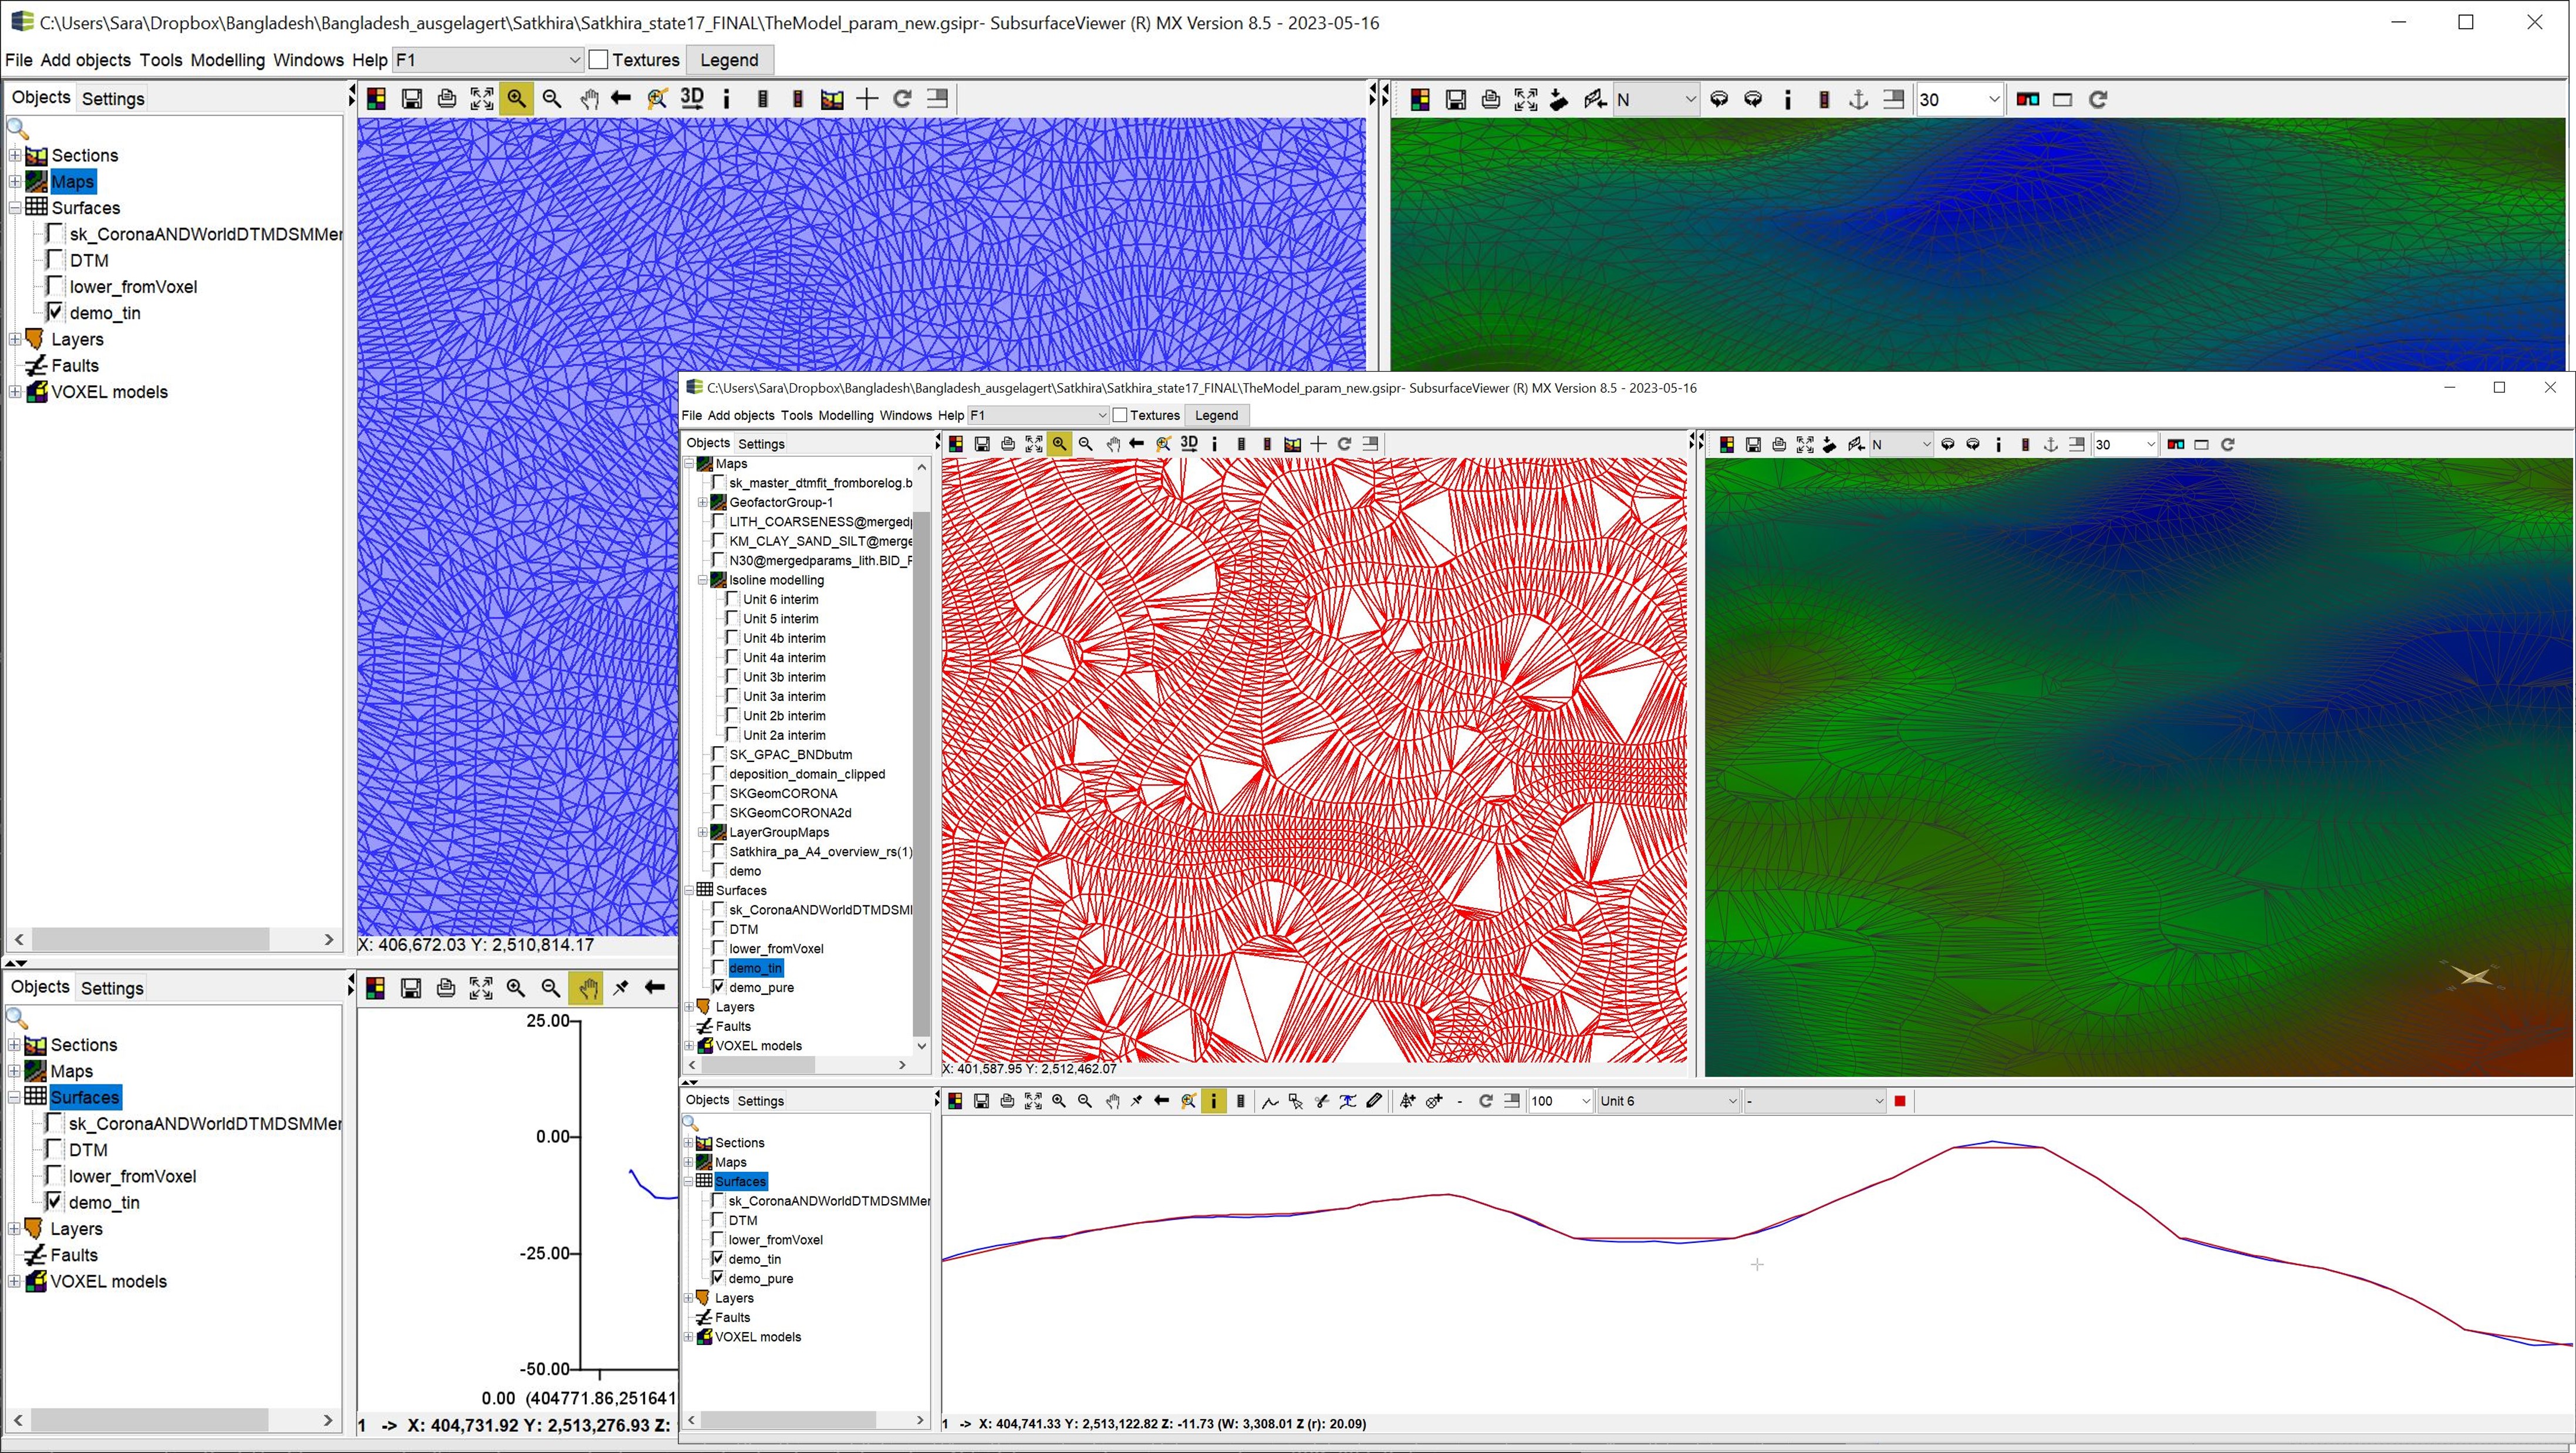
In the example we have created a triangulated surface from the isolines of a Geometry2D object once with Smoothing, medium (blue) and once on the point dataset (red). This gives you a good impression of the effects of these functions.
¶ General Options
Like all objects in SubsurfaceViewer, TINs have general options that are described here.
Since triangulations contain a boundary polygon (or several), these can be edited. As with geological layers and with Geometry2D, you need to use Switch on edit in the right click context menu to unlock the polygons for editing. Then you can delete, draw, copy and paste polygons (paste in the context menu). Read the article Geometry2D or Set layer spread for more information.
Populate all polygons/lines: Use this to condense the nodes on all the polygons' edge lines to a target distance between nodes.
Depopulate all polygons/lines: Thins the nodes on all lines of the polygons to a target distance.
Smooth all polygon/line: With this you condense the nodes on all edge lines to a target distance between the nodes, but a spline function takes care of smoothing the lines so that they look more curved.
¶ Extra functions -> Trim TIN
This allows you to edit or replace the automatically generated polygon of a TIN you have just created and use it to crop the TIN again with this polygon. This can be useful if you are interested in a certain part of your area covered by the TIN. You can clean up "unsightly" edges this way.
¶ Extra functions -> Trim TIN against DTM
Use this to trim a triangulated area to the extent of the digital terrain model defined in Project Settings. This should be available as a TIN.
¶ Extra functions -> Move & scale
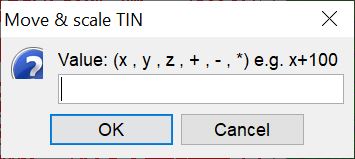
With these functions you can further manipulate your TINs by entering factors for shifting along the three axes ("+", "-") or for compressing or stretching ("*"). You can see in the example text of the window how to enter the formula for this. If you make several calculations in succession, you can achieve more complex transformations.
¶ Settings
The Settings are kept simple. They are visualisation options for the 2D and 3D views of the SubsurfaceViewer user interface.
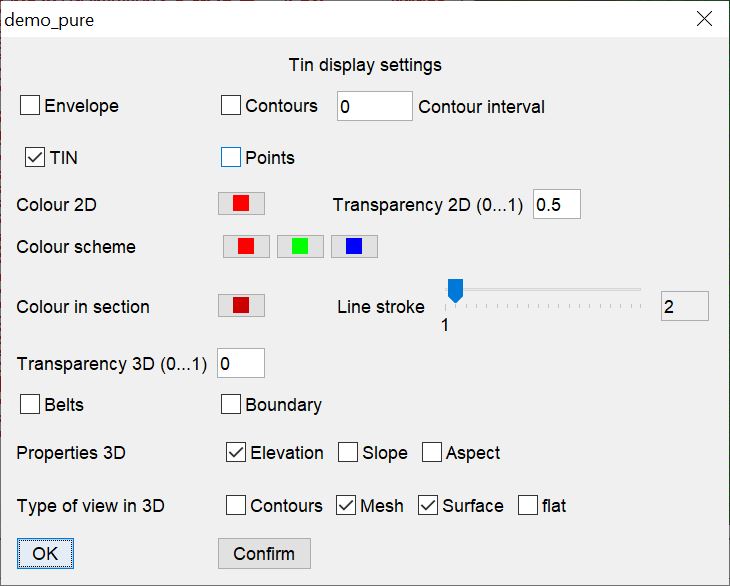
In the upper area are all the options for the 2D view. The 3D settings follow below.
Note: If you want to see visual examples follow the article on geological layers, because these are triangulations and therefore the visualisation options are almost identical.
2D:
Determine what you want to see and set check marks accordingly. Some things overlap.
- Should the border of the TIN be seen as a filled polygon? --> Envelope.
- Do you want to see the height points of the triangle mesh? --> Points (only with active TIN view, see below).
- Do you want to see the triangle mesh? --> TIN.
- Do you want to see the isolines of the surface? --> Contours and Contour interval in metres.
The field colour scheme below allows you to visualise the isolines/isopaches with a three-part colour gradient from low to high.
With colour 2D you define the colour of the TIN representation in the 2D view.
With colour scheme you can change the colour of the contour lines using the three colour buttons. The left colour corresponds to the lowest, the middle colour to the middle and the right colour to the highest height value of the surface. All colour values in between are interpolated.
With Colour in section you define the colour of the line in a profile section that intersects the TIN.
With Line stroke you can change the line thickness of all 2D-visualised lines in the 2D-view and in the profile section. This allows you to emphasise or visually soften certain layers when working or in a presentation.
3D:
Define what exactly you want to show and hide:
- With Transparency 3D (0...1) you define the transparency value of the surface shown (Surface), where the value 0 = opaque and 1 = completely transparent.
- If you have calculated isolines, you can activate Belts. You show the surface within every second section between the calculated isolines. Stripes are created. This can be helpful for certain visualisations over several layers or parameters.
- If you activate Boundary, the boundary is displayed in 3D.
You can set the visualisation for the surface:
- Contours: Isolines. If you have calculated isolines and Contours is inactive, you will still find a shading of the surfaces based on the isoline calculation.
- Mesh: Shows the triangle mesh in 3D.
- Surface: Shows the filled coloured layered surface in 3D.
- flat and Surface:
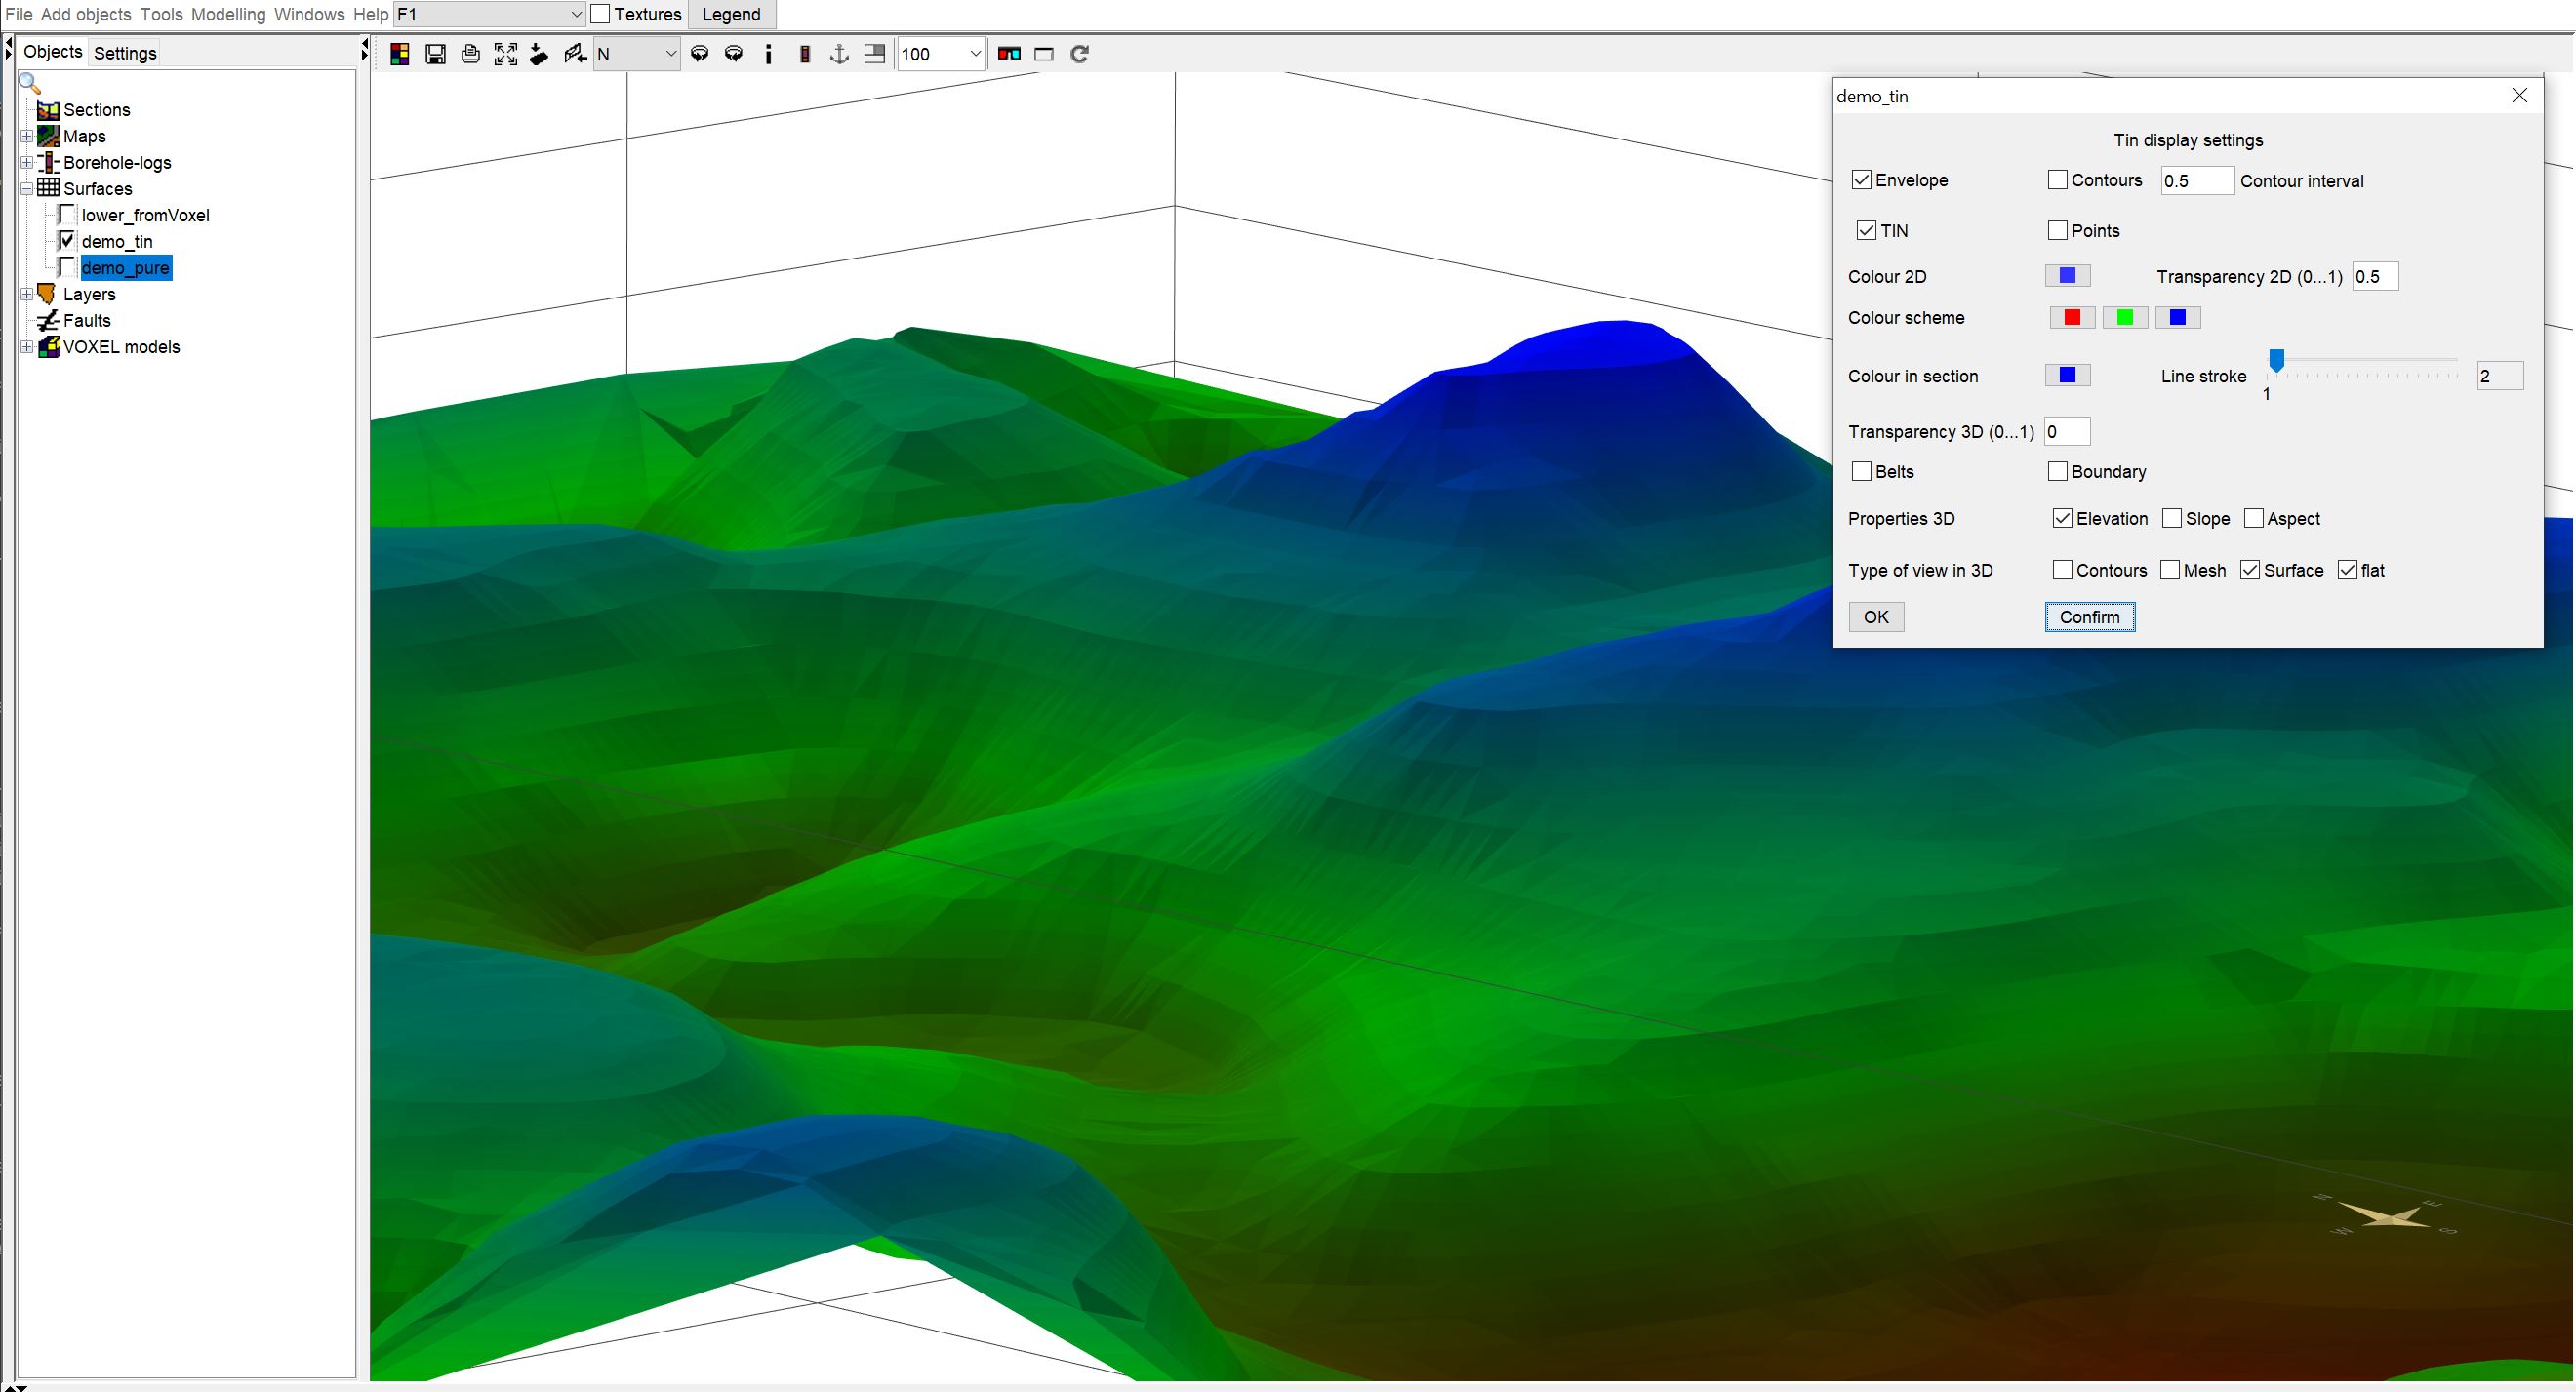
If you have this combination active, the triangles are rendered "flat". This allows you to view and analyse the surface with your colouring and the triangulation behind it in a different way.