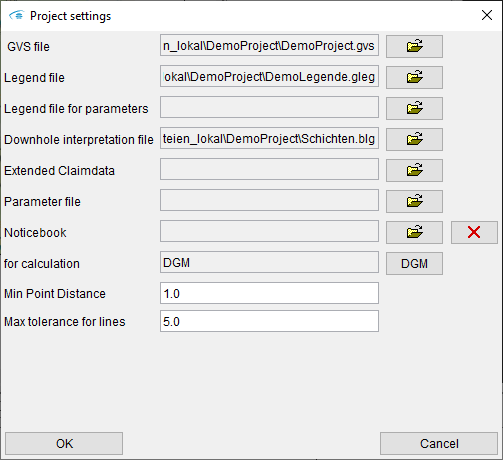
In the menu bar in File -> Project settings settings for the project can be done.
¶ GVS file
Background information: Subsoil Models in the SubsurfaceViewer
What does GVS mean?
"GVS" means "General Vertical Sequence". It determines the temporal sequence of the geological layers to be constructed. The GVS table is therefore an important part of the geological model. It must be created before the construction or importation of geological layers and is loaded with the project settings.
Typically, the GVS (Geologische Visualisation-Software) is built chronostratigraphically.
With the Subsurface Viewer, the geological layers are constructed by creating lower boundaries for each layer. The upper boundaries of the layers are calculated during the model computation from all underlying lower boundaries (the younger units). The program retrieves this information from the GVS table.
Sometimes you may also come across the name "SFB" or *.sfb file. This is the German designation for this file and stands for "Schichtenfolgebeschreibung," meaning "sequence of layers description."
The *.gvs-file can be created with a GVS-editor (GVS-editor) or extern with a text- or table-editor. If it is created extern it is important to save the table with TAB-seperators. Furthermore, there should be another line break after the last row.
At least three columns are required. Additional columns can be added for the visualization of textures. A GVS table has the following structure:
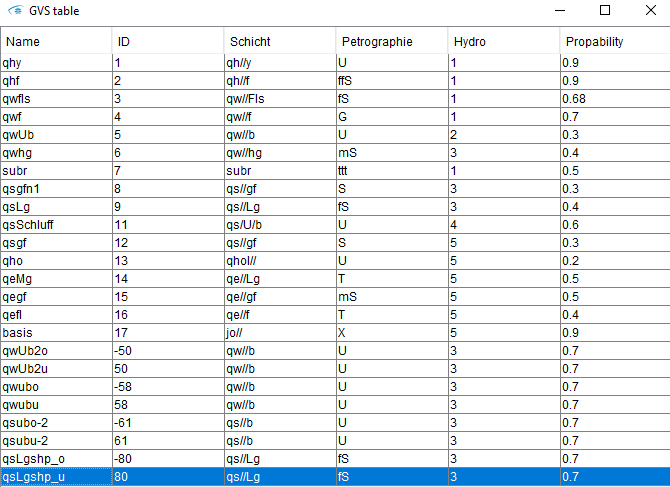
- Acronyms for the geological packages (layer) are assigned in the first column. The name is crucial for the layer's designation in the 2D view, in the section view's drop-down menu, and for the designation or assignment of the lower edges to a layer.
- The second column contains a Layer ID that must be made up of an integer. The ID value must gradually increase, starting with the most recent geological unit (ID = 1). Lentil shaped soils must be defined with a top and a base value. The base-value is positive while the top-value is negative. Lintils or their IDs must not be in the ID-ascending file sequence. It is recommended to use a ID which can not be mixed up with the main IDs.
- A layer name or description is added in the third column. This field is used to display legends and may provide information about the geology or hydrostratigraphy.
- Information for visualizing and exporting model results can be entered in additional fields. In the example illustration details on the hydrography and petrography are set. The view of the model can be changed using the petrography from a strictly stratigraphic to a lithological one. Textures can be assigned to these values by using a link to the gleg-Legendendatei. The layer can be summarized using the hydrostratigraphic unit classification in exported layer for ModFlow. The transmissivity or the coefficient of permeability can be specified as parameters in the GVS.
Important: The line number of each entry determines the sequence of the layers. The youngest geological unit is listed in the first line, and the oldest unit is listed in the last line.
Tip: It can happen that stratigraphic units have different names depending on the region of the model or the origin of the model creator. You can use additional columns to switch between these regional designations if, for example, you want to present your model both regionally and internationally. If you come across a geological unit whose stratigraphic assignment appears uncertain, you could also use a column as a marker.
¶ Legend file
Legendendfiles (.gleg, .nvleg, .voleg, .beleg und .paleg) are data that are used to color objects in the SubsurfaceViewer. Information about the formats are here.
The ending determines the legend type. The globally used legend is loaded in the project settings. It always has the extension *.gleg. With it you define colourings for the constructed geological layers and the designations in the layer descriptions of the boreholes. If a geological map is available as a Shape, the entries of the polygon names can also be used to colour the map per *.gleg file.
The colour information must be available as RGBA value (red-green-blue-alpha). All legend files can be created and edited externally or in the Legend Editor of the SubsurfaceViewer.
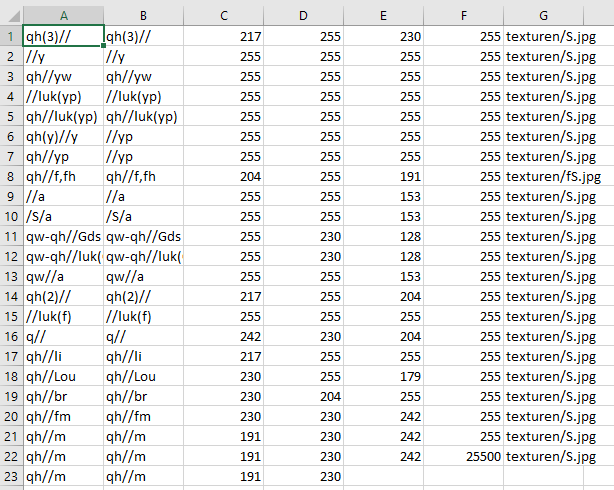
The structure of the *.gleg-legend is as follows:
The borehole sequence or the abbreviation of the layer name are found in column A. The complete name is entered in column B. The RGB values are contained in the next three columns (C - E). Column F contains the color satiation (0 = 0% to 255 = 100% satiation). The link is located in column G next to the textures that are added to the borehole sequences or Layer Visualization. If the legendeneditor is used for creation, the link must be added to a Texteditor. This needs to be done when the legend data is edited in the legend editor.
¶ Legend file for parameters
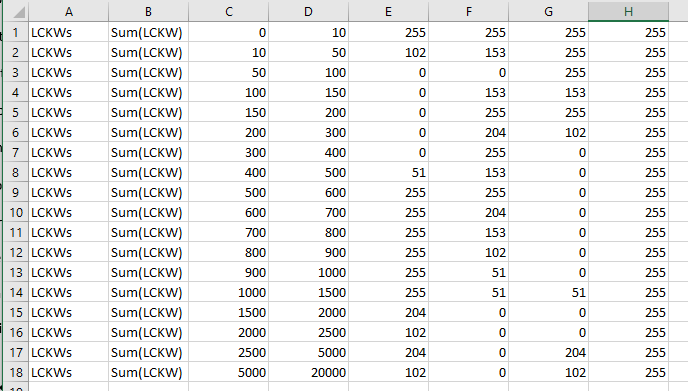
The legend file for parameter values .nvleg (numerical value legend) regulates the color of value ranges and has the following structure:
The abbreviation is in clumn A, while column B gives the full name or description of a parameter. The minimum and maximum values for the category's value range are shown in column C and D. The RGB values, along with the color saturation value (0 = 0% to 255 = 100%), are contained in the cplumns E to H. The *.nvleg-legendfile is valid for numerical values at all borehole positions (*.plg-Datei), which were loaded with the borehole data map.
¶ Downhole interpretation file
The downhole interpretation file (.blg, Downhole interpretation file) is a mandatory file if you want to make profile section constructions based on drillings. It contains the layer descriptions for the boreholes.
If a blank project is started and a borehole data map is added, two files must be loaded with the form: a borehole master file *.bid-Datei and a borehole interpretation file .blg. The .blg-file is automatically added to the project settings. When the project is saved, the path link is added to the resulting project file. This ensures the link to the borehole interpretation for the model as one of the most important basic data for modelling.
It is possible to add borehole maps (.bid files) with different .blg files to the project. For the profile section construction, however, only the borehole interpretation from the .blg file selected here in the project settings is displayed.
In order to add borehole interpretations based on different techniques and with different borehole logs (e.g. interpreted geoelectric logs or geotechnical design sections next to regular boreholes) it is necessary to merge this information into one .blg file. This is then loaded here in the project settings.
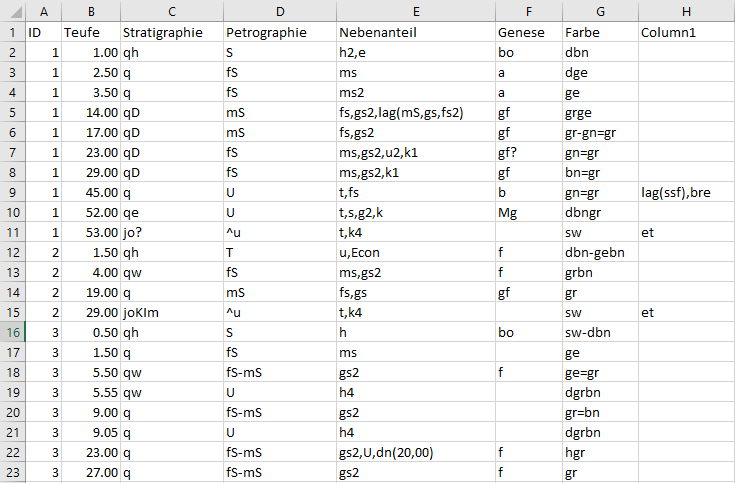
The structure of a .blg file is as follows. The ID or the name on column A is used to connect the relevant borehole master data from the .bid-File to the relevant information.
The depth of the layer is described in column B. The smallest lower edge, which is designated for this borehole, yields the upper edge.
The data is managed in the system in sorted order even if the file is not sorted. If, for example, there are several descriptions of a borehole, they are displayed in the correct order on the borehole. In certain cases this can lead to misinterpretations, so it is recommended to work with corrected borehole data.
In the other columns, information on the specified layer can be stored. Typically, these columns contain information on stratigraphy, petrography, genesis, colour or geoelectric measurements.
Note:
Use a (.) for the decimal separation, to ensure the ability to load the data.
¶ Extended Claimdata
You can also add a *.ebid-file with expanded master data under "Extended Claimdata" in addition to the *.bid-file.
¶ Parameter file
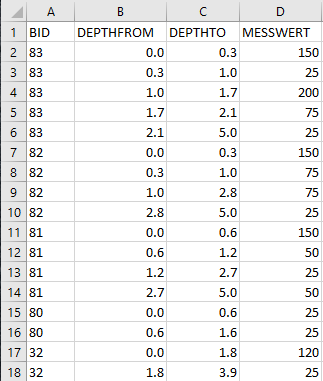
In the SubsurfaceViewer, parameters are captured as interval or intermittent borehole data. Thus, it is necessary to provide both the upper and lower bounds of the value range, as shown in the illustration to the right.
By distinguishing the parameter values from the classical continuous borehole data, the different data character is respected in this approach. The data must be numerical.
¶ Notebook
It is possible to upload a notebook file in XML format that was created in a previous project by including notes into profile cuts or object properties. Read further information about the creation of notes here.
¶ for calculation
The absolute surface of the model is selected here. Normally this is a Digital Terrain Model (DGM). The object must already be loaded in the project, so it is available for selection via the DGM button. For the calculation of layers a selection is obligatory. If the layers are calculated via triangulations, the terrain model must also be available as a triangulation. If you have a terrain model in raster format, you can load it as a triangulation. A description of the procedure can be found here: Load data.
¶ Min Point Distance
The Min. Point Distance specifies the point distance in meters for calculating TINs from imported points or raster data. Points closer than the minimum point distance are bypassed in the triangulation calculation. The imported value controls the resolution and quality of your triangle mesh. In addition, the minimum point distance is also used in other areas of the program. When drawing freehand, it is used to automatically clean up the line from excess node points. All nodes with a smaller distance than the minimum point distance are sorted out. It is also used when merging coordinate entries into one coordinate in the Data tree of the Parameter Manager. When transforming 3D line shapes (ESRI) to profile sections (Import profile sections) it can be changed to values < 1 if the automatic line merging is to take place with distances of less than 1 meter.
¶ Max tolerance for lines
The setting "Max tolerance for lines" is a factor in the creation of lentil shaped siols. A thorough and clean 3D construction of kinetic bodies is complex. Constructing consistent line segments from both the upper and lower sides within the profile cut is necessary. Additionally, it must be ensured that the distribution polygon's edge in 2D view maintains consistency. Inaccuracies result in implausible triangulation results for lentil shaped bodies. To achieve greater precision, it is possible to implement the maximum tolerance for lines. It provides a tolerance factor for errors in polygon boundaries and endpoints of upper and base lines. The value is expressed in meters.