You load geological layers in the Mainmenubar under Add objects -> Shape file (*.shp). A format description is linked here.
You can:
- load 2D and 3D polygon shapes
- Load 2D and 3D point shapes
- Load 2D point shapes
**Shape objects can only be displayed in SubsurfaceViewer. They cannot be edited.
Note: If you have 3D line shapes as a representation of externally created profile sections, you can convert them into a SubsurfaceViewer profile section and edit them further or integrate them into a model. Read the instructions here.
¶ General Options
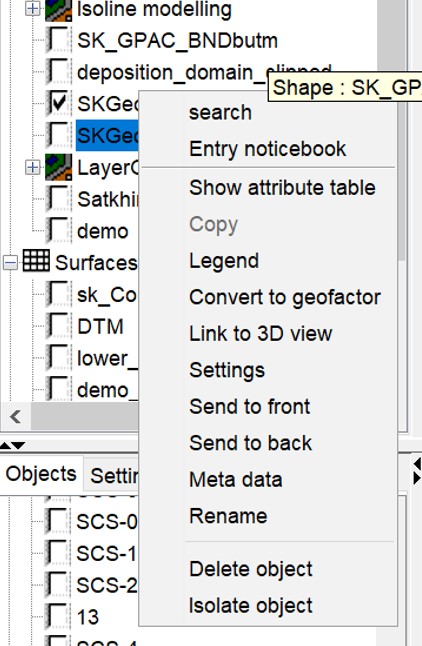
The general options of the right click context menu are described here.
Tip: If you want to edit the geoemtries of the Shape object (lines/polygons) after all, you must select all the objects via Show attribute table (see below) and place them in the clipboard with Copy. Then create a Geometry2D object and copy everything into it. Then you can work in the Geometry2D object.
¶ Selection of Geometries
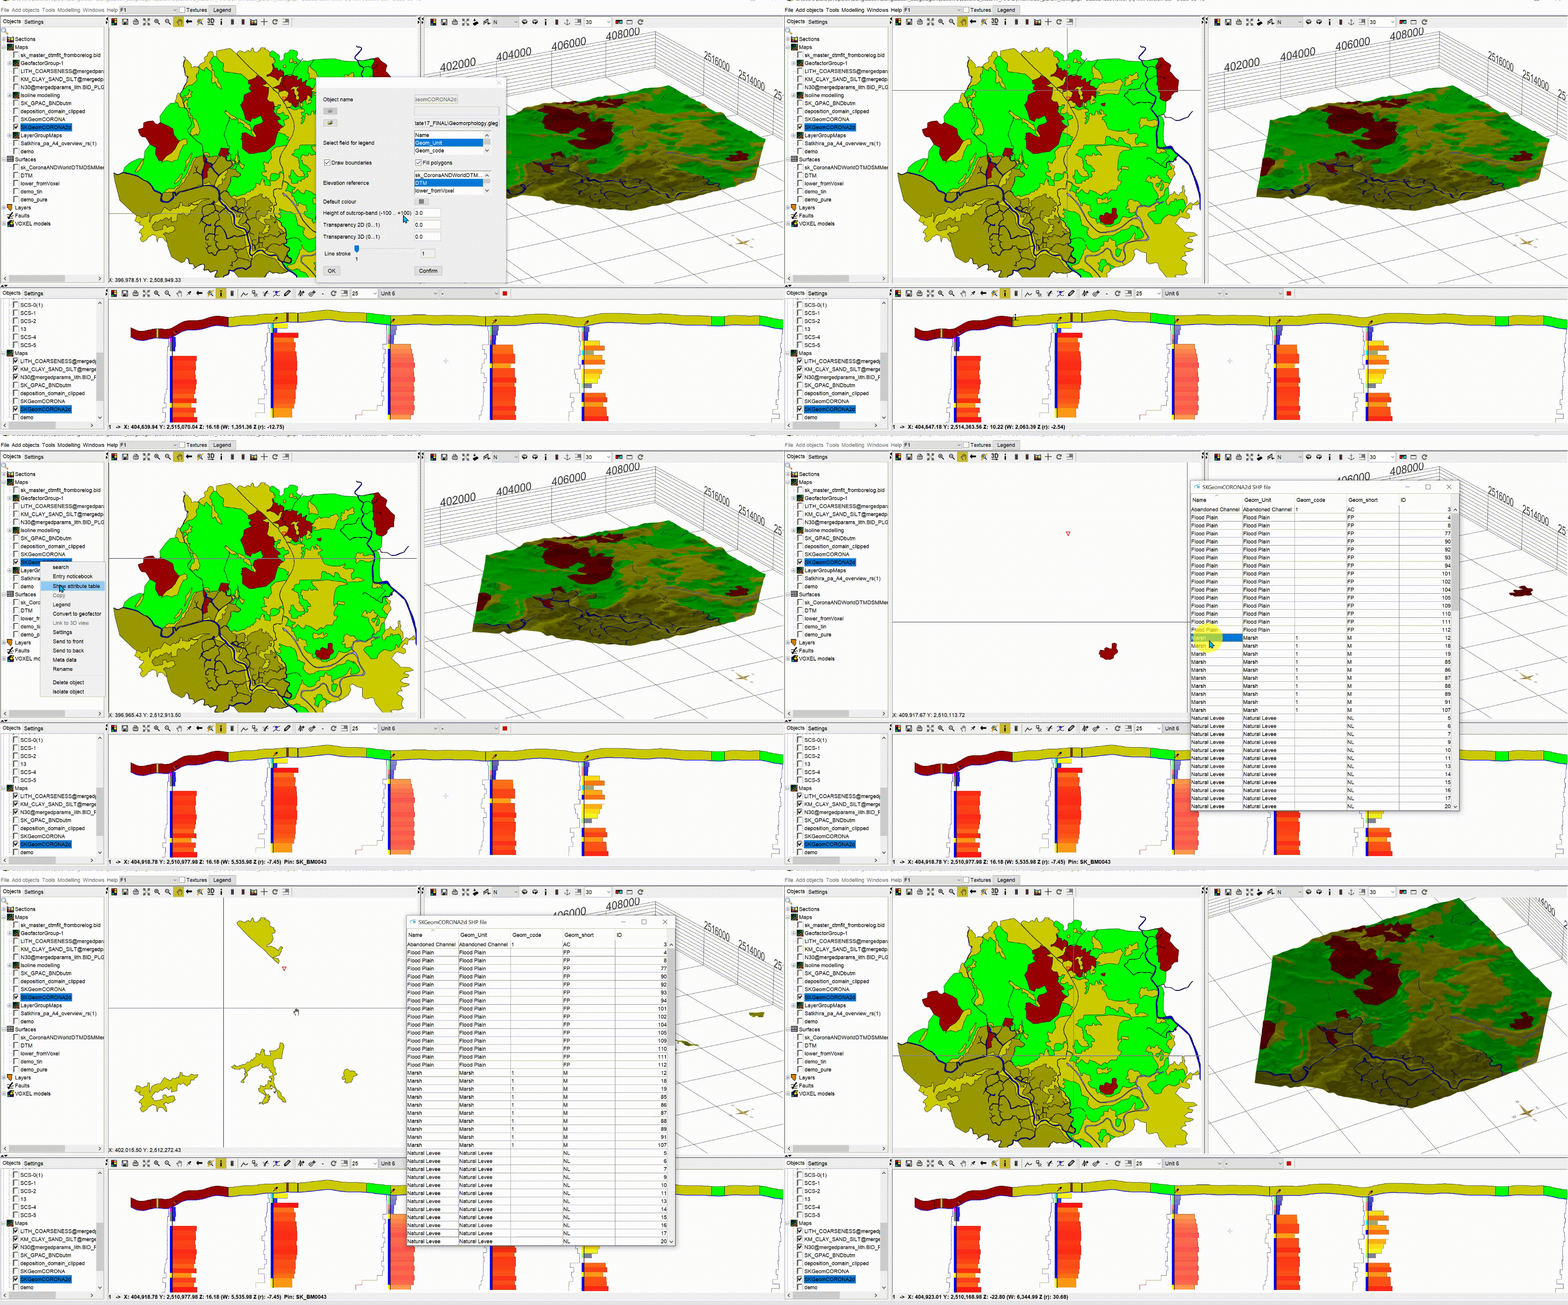
The visibility of individual Shape objects can be easily filtered. To do this, open the attribute table with right click -> Show attribute table and select the corresponding entries. Then only the objects of the shape marked in the table become visible in 2D and 3D.
The marked polygons can be copied to the clipboard. From there they can be copied as bounding polygons into TINs, Layers or Geometry2D objects. In connection with Voxel Models they are used to set boundaries. The project legend and the selected field name in the shape file are used to define the colours. Shape files are assigned to the object type Maps.
¶ Convert to geofactor
This converts a map in shape format (polygons) into a geofactor raster. The result is an index raster.
Important note: The assignment of the indices in the raster from the polygons can be done if you have a meaningful column with integers, i.e. the indices, in the attributes of the polygon shape. Otherwise, no geofactor can be generated or you will not get the desired result.
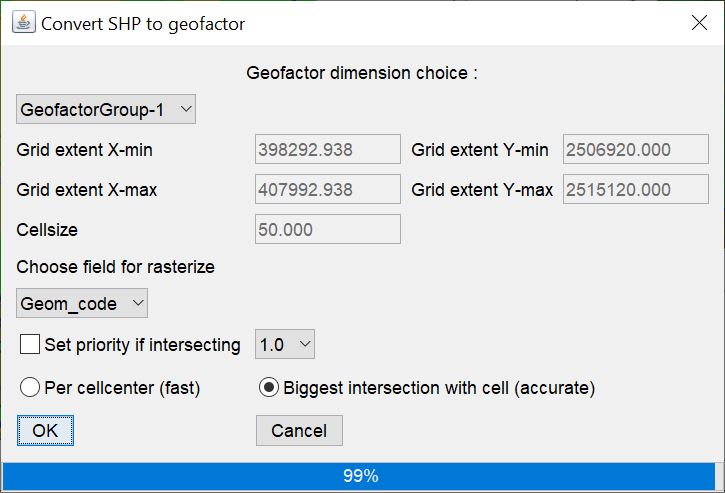
This function can be used if you want to include a map in shape format in a Multicriteria_decision. To use this function, you must have loaded geofactors in advance, from which the geometry of the resulting geofactor is drawn.
Select the correct geometry via the dropdown list in the first row by assigning the respective geofactor subfolder.
With Choose field for rasterize you select the attribute column of the shape, which contains a meaningful index of the polygons and their meaning.
The conversion algorithm offers two different methods for shaving:
- Per cellcenter (fast): This tests the centres of the grid cells as XYZ coordinates if it is in a polygon. If "Yes", this grid cell receives the index assigned to the polygon in the selected attribute series. This is a fast algorithm, but less accurate than 2.
- Biggest intersection with cell (accurate): This method calculates the polygon area intersections with the complete extent of the raster cell. The cell is given the index of the polygon that made up the largest area in the cell. This calculation can take several minutes.
With Set priotrity if intersecting you set an index in the priority with the Dropdown list. This means that as soon as the polygon with this index "touches" or intersects a raster cell, the cell gets this index. This makes most sense if you have narrow lineaments in your shape geometries and you do not want to "lose" them through the raster resolution.
¶ Settings
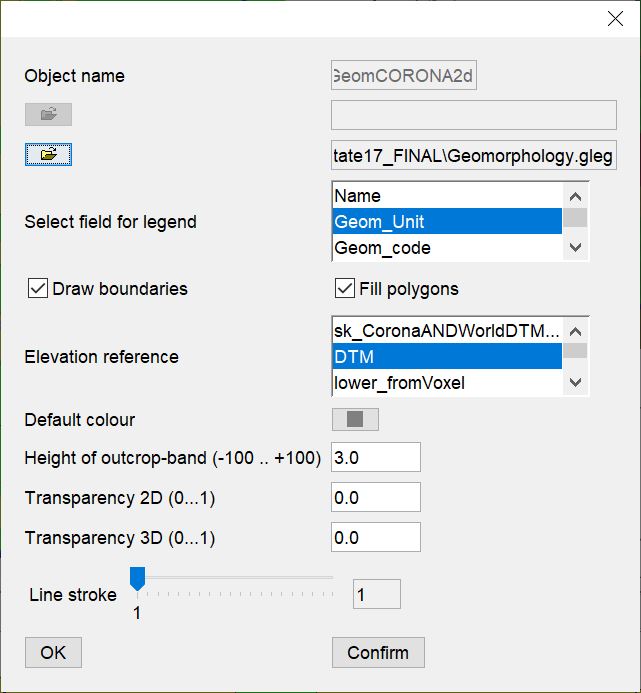
You will see this dialogue when you load the object, i.e. you can address all the settings directly when loading. You can change all the settings of the object at any time.
You can load your own legend in the *.gleg format for colouring lines and polygons for a loaded Shape object. Do this with the second  button in the row. With Select field for legend you select the attribute data series from the shape file that is to receive the legend reference. If this data series contains texts that are contained in the project legend, you do not need to load your own legend. The colours are then loaded from the project legend.
The functions below are relevant if you have loaded polygons.
With Draw boundaries you can select whether the polygons should show an outer line, if you have loaded a polygon shape. With Fill polygons you determine whether the polygons should be filled with colour.
The elevation of 2D polygons can be referenced with Elevation reference by a grid or a TIN. The polygons are displayed in the 3D window with the respective surface, for example with a Digital Terrain Model (DTM). You can see this in the example we have listed under Selection of geometries.
In the profile sections in the 2D Cross-Section View, the shape polygons are displayed as a band on the assigned surface, for example "lying" on the DTM. The band has the thickness in metres entered under Height of outcrop-band. You can see this in the example we have listed under Selection of geometries. The band is used for orientation if you want to adapt your layer outcrops to a geological map during modelling.
Note: If you use 3D polygons, these are each given the height position from the file and the transmission of a height reference is inactive. If you want to see polygon shapes as textures on your elevation model, you should load them as 2D shapes.
With Default colour you set a default colour that will be used for all geometries that have not yet been assigned a colour, or if you do not need a legend for this shape at all.
With Line stroke you set the line width for the drawn shape geometries to highlight them.
¶ Convert 2D line shape to profile section line(s)
You can generate profile cross-sections from a 2D line shape. Therefor, use the function Create cross-section along 2D-lines. Each connected line receives its own, initially synthetic, profile section.
¶ Convert 3D Line Shapes to Profile Sections
Use this function to convert 3D line shapes as profile sections into SubsurfaceViewer profile sections, to edit them.
As this is an issue that might concern you when matching regional models with other modelling groups, we have described the conversion with an integration into an existing model in this article.
It is recommended to have created and loaded a GVS and a corresponding projectlegend. You should have defined a DTM in the Project Settings if you want to see coloured layer polygons in the converted profile section.
Here the general procedure is described:
-
Load a profile section as a 3D line shape into the programme.
-
You have looked which line attribute gives you information about the geological unit, and which you have loaded as a GVS and legend in the project.
-
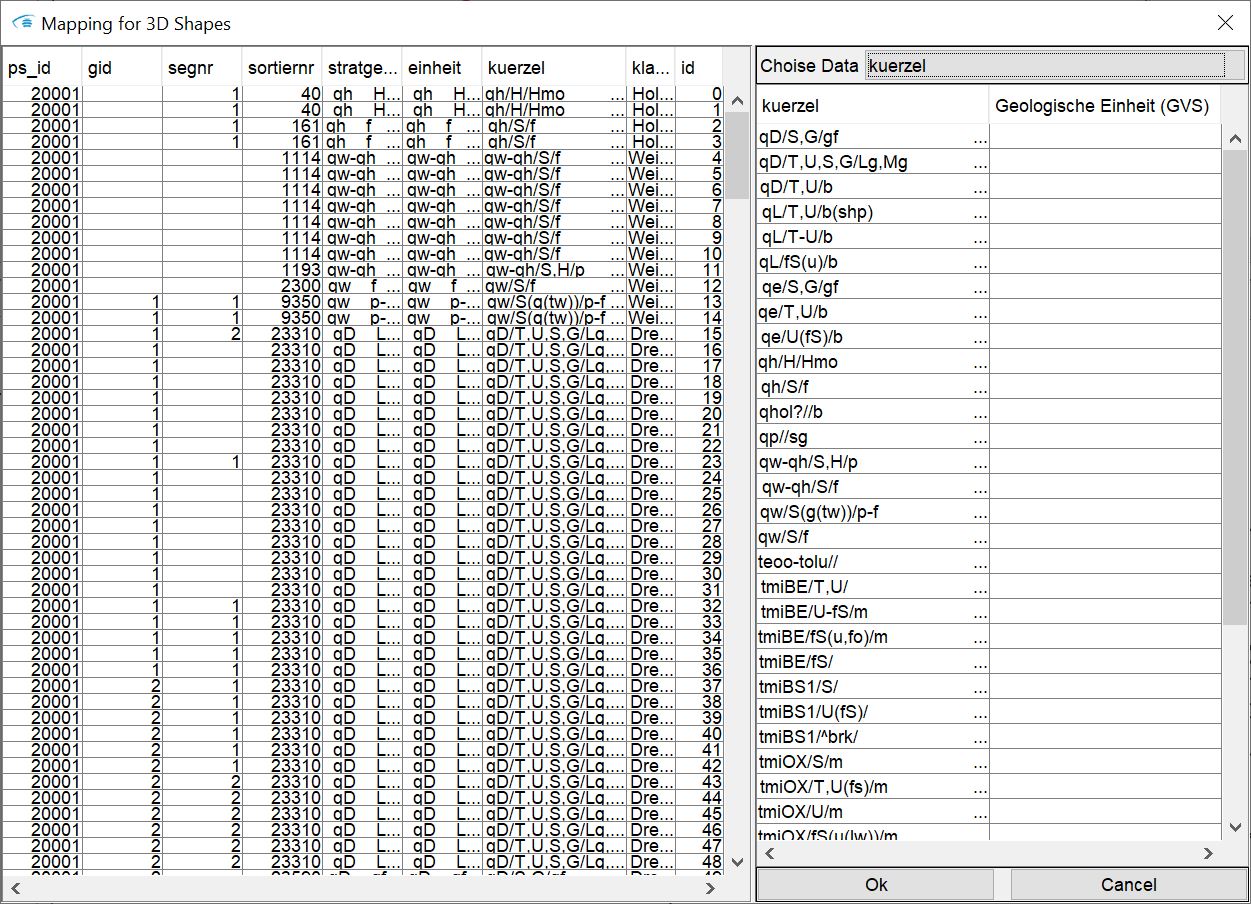
Open the dialogue Convert to cross-section: The attribute table of the shape object is shown on the left side. On the right side you can select a column with the upper dropdown list. The occurring names of the lines are selected without multiple naming. You will see them in the left column of the table that has appeared below the Dropdown list. On the right side you have the possibility to assign these names to a layer from the GVS, if the names do not match. You can assign any names here. **If the row in this column remains empty, the lines of the line shape in the resulting SubsurfaceViewer profile section receive the original names from the shape file.
Note: The example shown has kindly been made available to us by the hydrogeological department of the Landesamt Bergbau, Energie und Geologie des Landes Niedersachsen (LBEG).
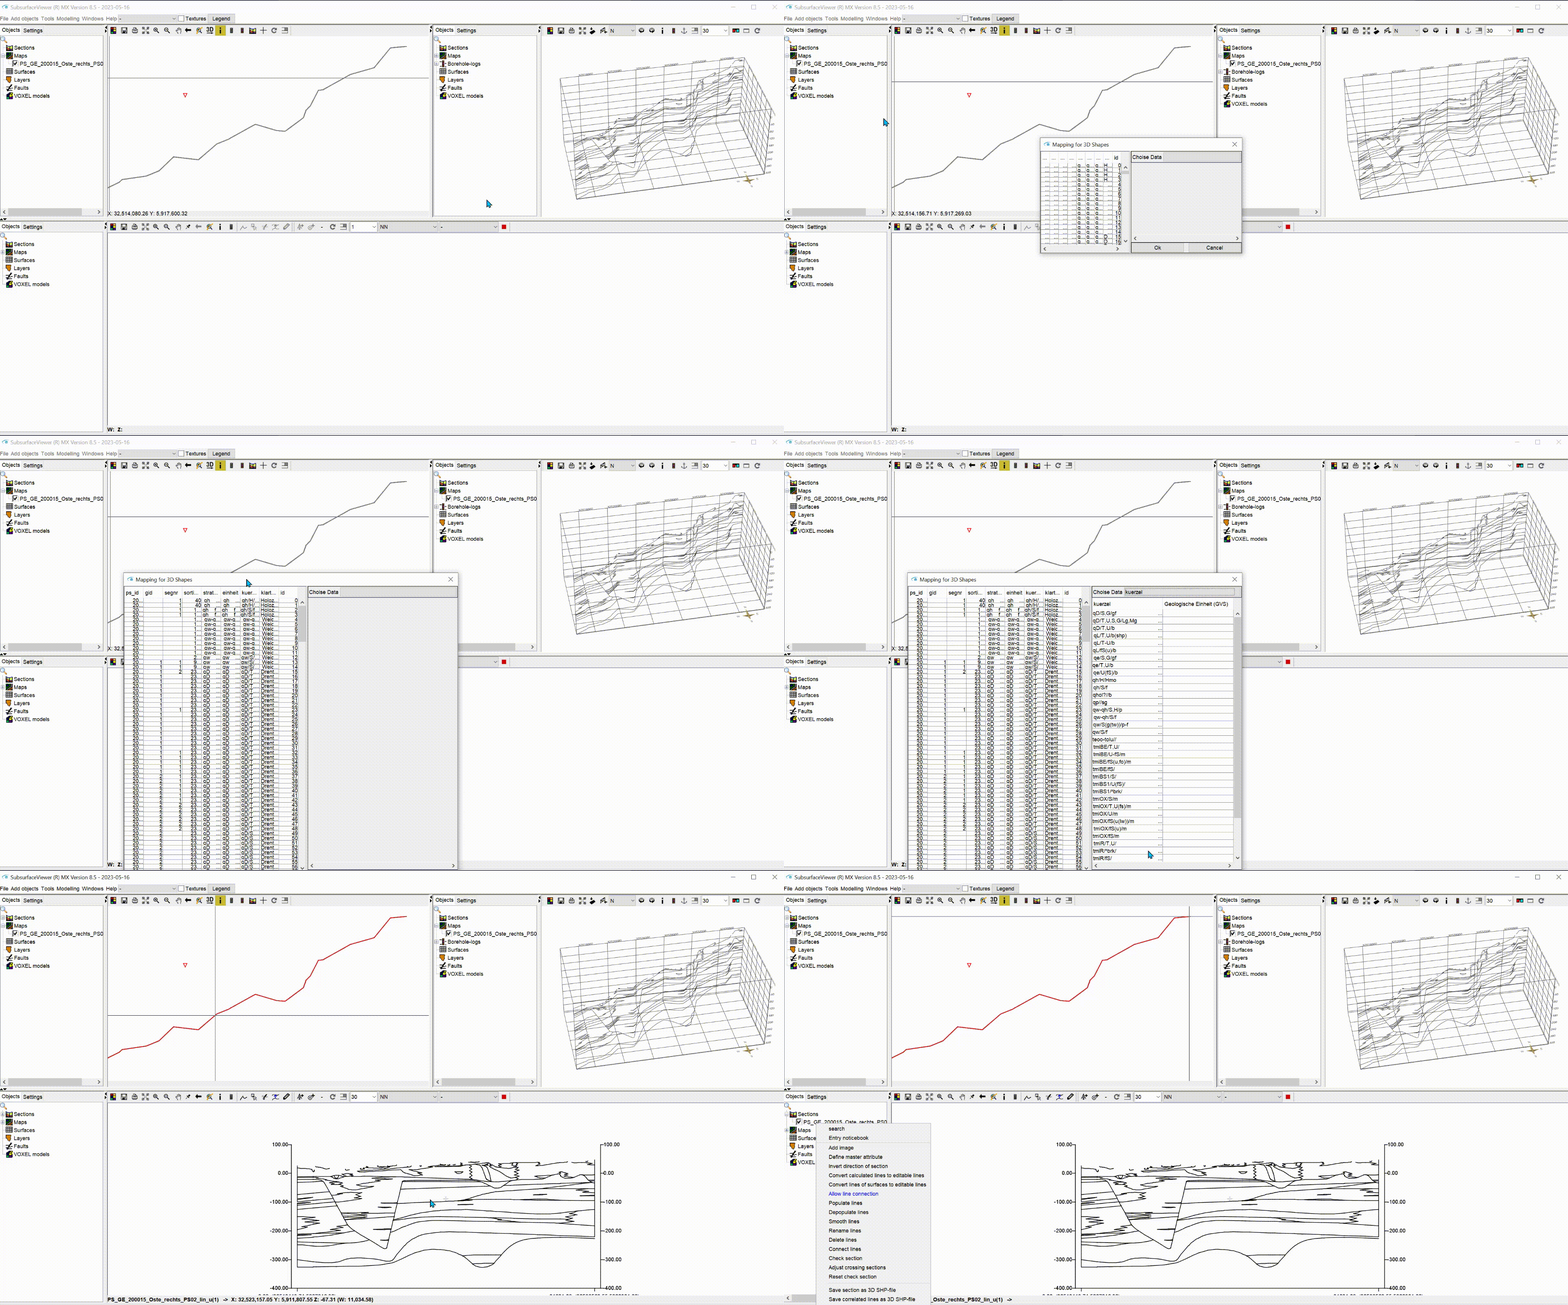
When you are finished with the assignment in the dialogue, press OK and the section is created.
All lines from the 3D line shape are now available for editing in the profile section. You can compare these profiles with already constructed profile sections via the Cross points.
Note: If you find the line course of the converted profile section strange during a conversion, feel free to contact us. The algorithm is still young and there might not have been all possible cases of line configurations in these shape files yet.
Important Note: Before you save the cut and reload it later, set a suppression of the automatic line connection when reloading in the Profile Cut Configuration. This is done with the right click context menu and Prohibit line connection. If Allow line connection is available, the automatic line connection is already suppressed. You must do this as long as you have not yet edited the profiles to be completely "SubsurfaceViewer-compatible". For more information read here.