You load voxel models in the Main Menu Bar under Add objects -> Voxel model.
A loaded voxel model is displayed in the object tree under the category VOXEL model.
Note: If you load a regular voxel model in an ASCII format, you will need space in your temporary directory. You can select this individually under Programme Settings.
A voxel model is a three-dimensional grid displayed by volumetric cells in the form of cubes, suitable for 3D analysis in SubsurfaceViewer. Each voxel can contain a variety of parameters. In addition, there are regular voxels, whose depth and length (on the horizontal axes) are the same, or irregular voxels, where the extent along the vertical axis varies from voxel cell to voxel cell. Here you can read about the formats.
The voxel model can be cut in different configurations in the 3D view, displayed as a fence diagram, filtered and statistically analysed. In the 2D view, the voxel model appears as a horizontal section. You can set the absolute height of this section with the Settings. In the Cross-section view is a voxel model (after a Refresh if necessary) in the background of other active data. Area-filling data, such as geological layers, are provided with a transparency.
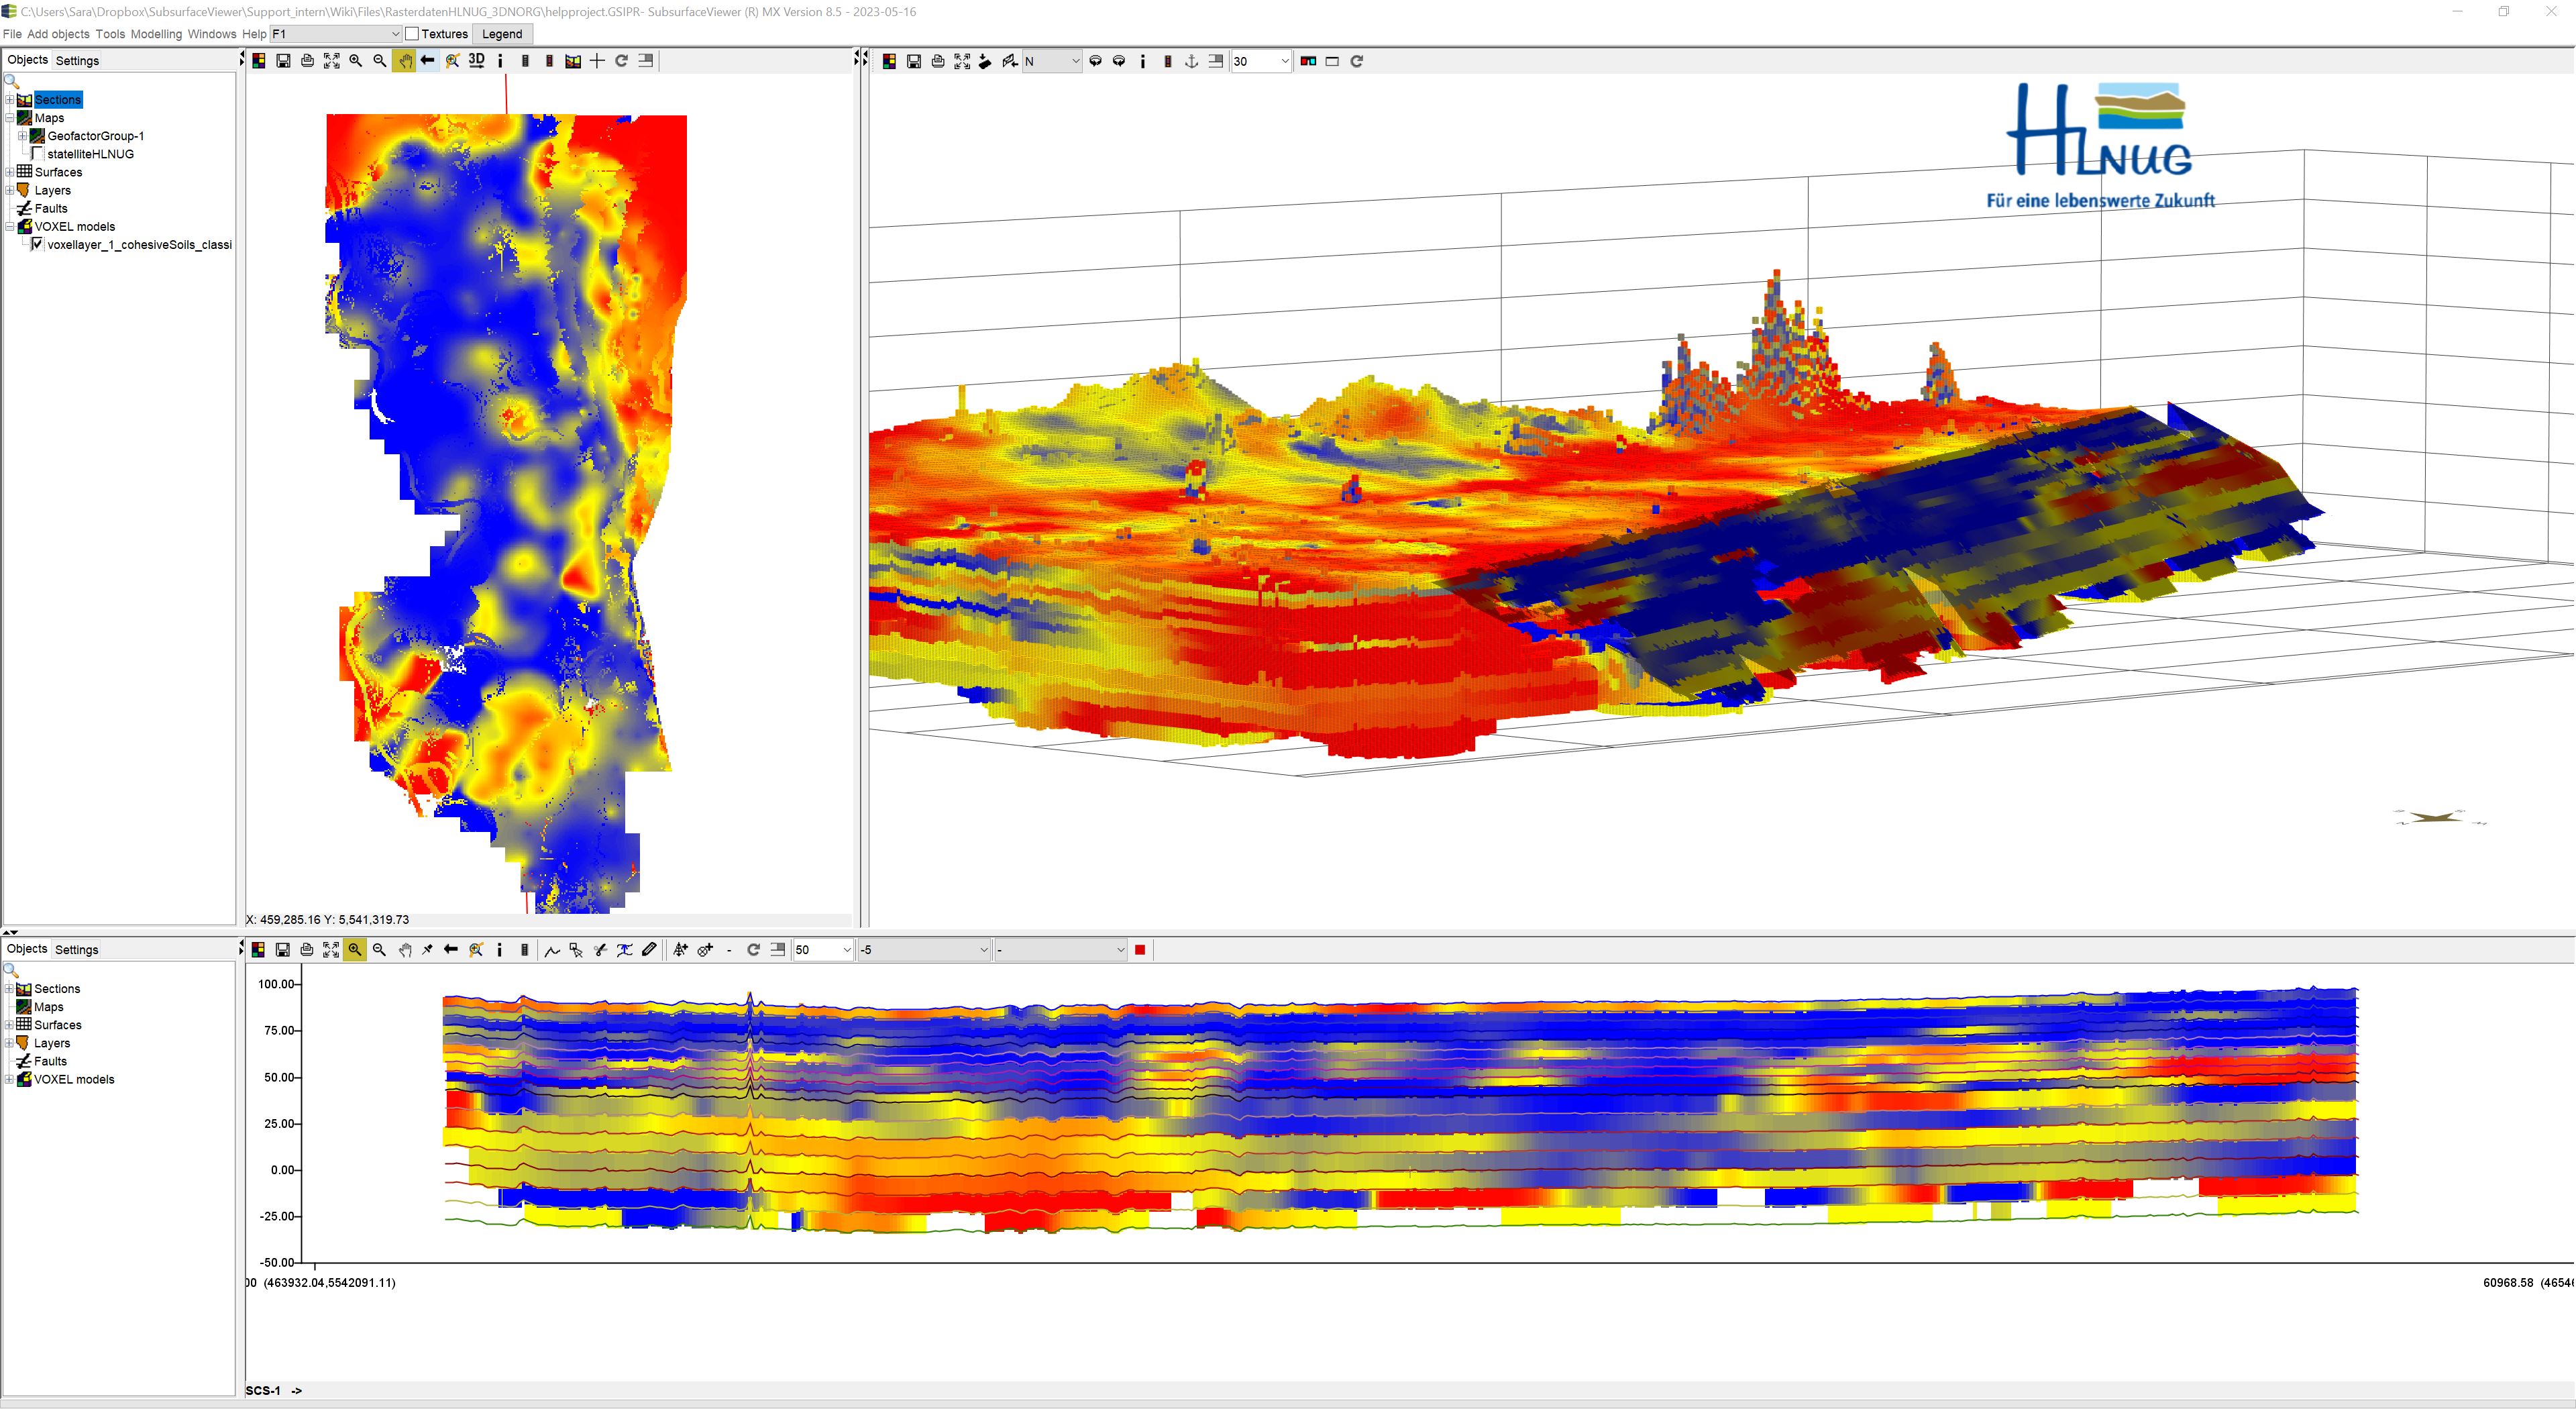
Note: The sample models shown on this page are Satkhira and 3D-NORG. Satkhira was kindly provided by the Geological Survey of Bangladesh (GSB) and the German Federal Institute for Geosciences and Natural Resources (BGR), and 3D-NORG by the Hessian State Office for Nature, Environment and Geology (HLNUG) for some illustrations and functional explanations. The representations are not suitable as an information system for users. Please contact the institutions if you want to use evaluations or need information.
¶ Create voxel models
If you want to create a voxel model with SubsurfaceViewer, you have the following options:
- If you have finalised a model with geological layers, read here.
- If you have 3D point data available, use the interpolation options, such as IDW and Kriging.
- If you have 2D point data, you can use IDW and Kriging first. If you have created 2D raster data that refer to specific horizons, read the appropriate section in the article Integrate Model Data from Other Sources.
¶ General Options
With a right click on a voxel in the object tree, the function Save horizontal slice as grid can be found next to the Standard functions and the Settings. This saves the horizontal slice through the voxel model currently visualised in the 2D view as a grid. You can find out how to set the absolute height of the section in the section Settings.
¶ Evaluate voxel models
You can... :
- ... filter voxel models and further examine the filtered portion.
- ... Evaluate descriptive statistics on filtered and unfiltered voxels. This includes extraction-of-geofactors as a 2D statistical grid.
- ... map voxel data as synthetic boreholes or sections -> Visual_analysis, Sections or Extraction of voxel data at XY-positions.
- ... Classify voxel contents or Merge.
- ... extract specific interfaces and thicknesses as 2D rasters.
- ... evaluate profile type maps.
¶ Settings
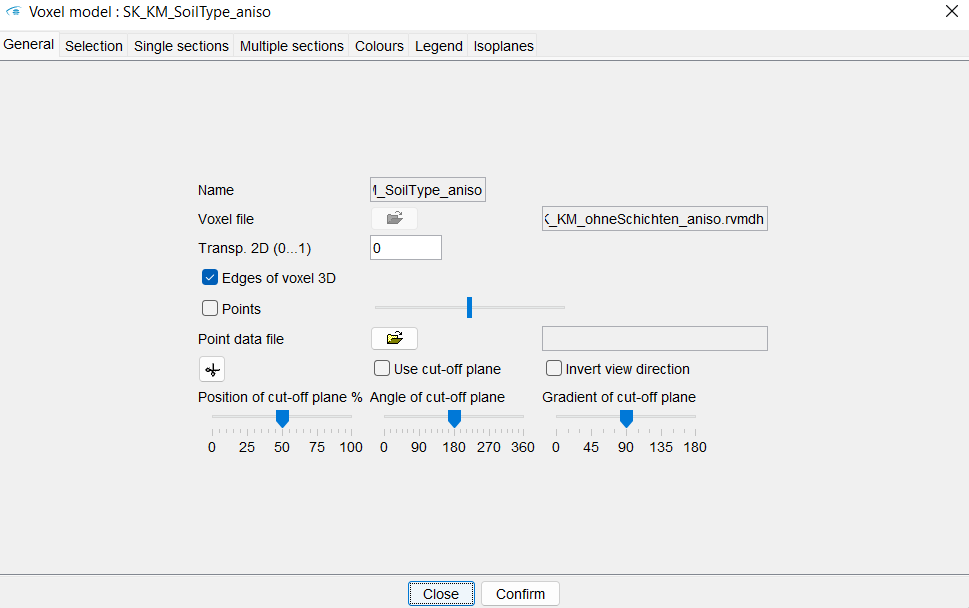
Unlike many other SubsurfaceViewer objects, the Settings for voxel models contain many evaluation options. Therefore, you can continue to work in the user interface.
You open the dialogue for the Settings via the right-click context menu. You will see 7 tabs. The Isoplanes tab is only accessible for regular voxels. For irregular voxels, the Calculate tab is located at this point.
¶ General

Under General general visualisation options are set.
With *Transp. 2D you set the transparency of the model with 0 = opaque and 1 = completely transparent.
By checking Edges of voxel 3D, the edges of the cube can be made visible in the voxel. They are shown as bright lines. There is an example in the article Formats.
With a tick at Points, points will be loaded to the voxel. To do this, a file must be loaded with the  symbol. With the slider the points can be enlarged or reduced. This function is intended for quick matching of point data with an interpolated voxel from that data. For the formats for the points, refer to the section for Kriging and IDW. The colouring of the points are based on the set colouring of the voxel model. You can see the points in the 3D view.
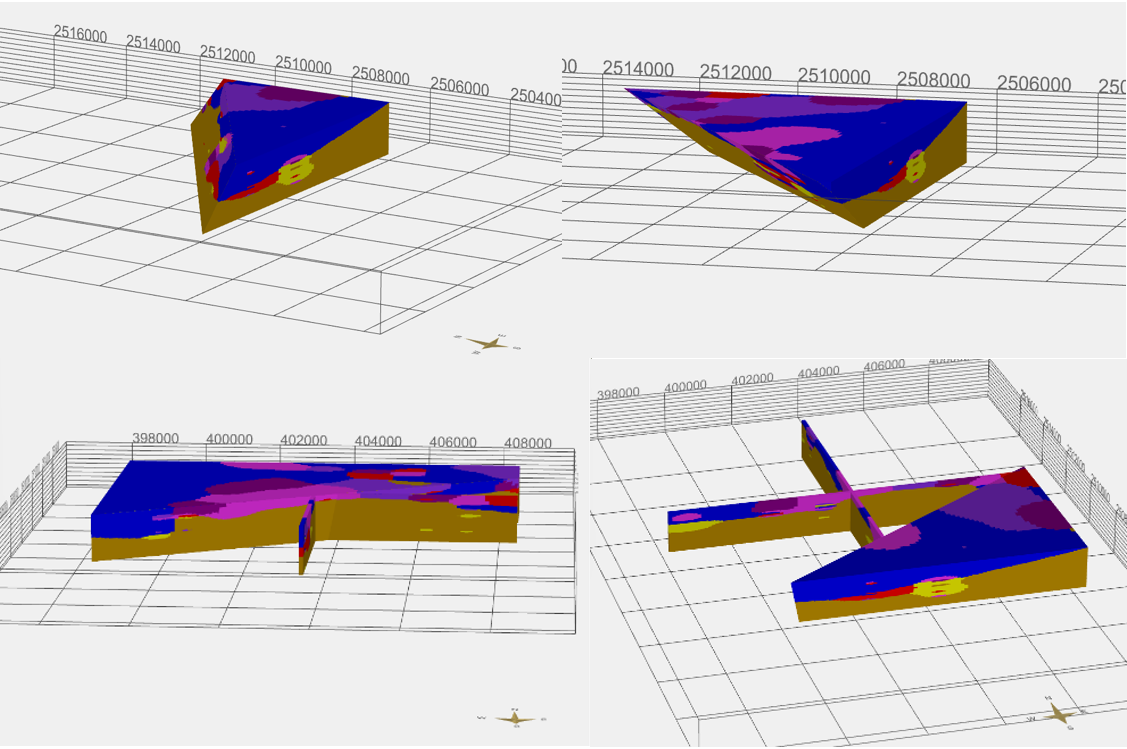
With a check mark at use cut-off plane the model is cut along an edge. In the 3D view, the tool Setup of the angel for cut-off plane for voxel model  is needed to set a cut-off plane at this position. The cut-off plane is perpendicular to the view ray. With Position of cut-off plane it is determined where the cut-off line is set, which cuts off the model. At 0% is no cut and the further the slider is moved towards 100% the more is cut off. With Angel of cut off-plane the angle out of the line of sight is set for the cut-off plane.
¶ Selection
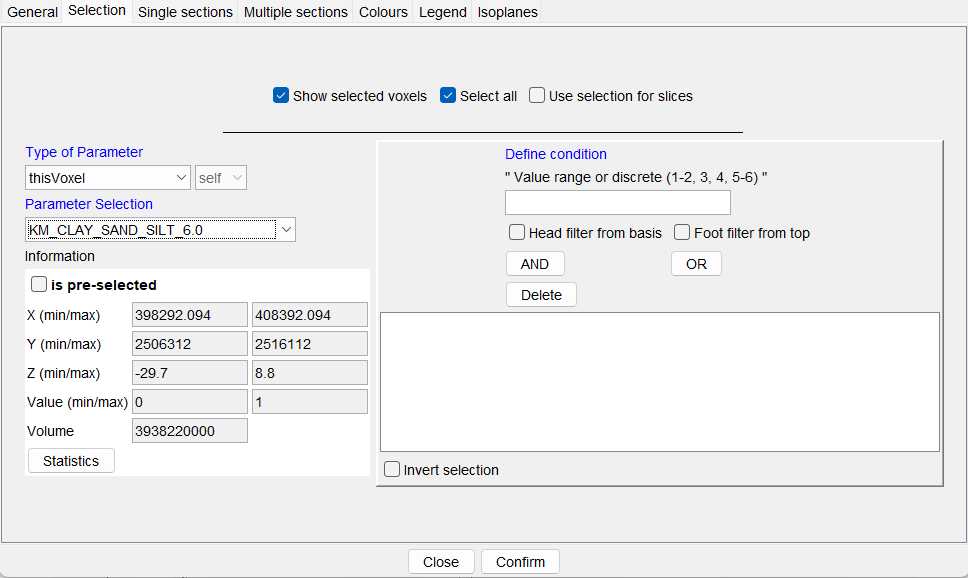
This is the filter tool of SubsurfaceViewer, which is tailored to voxel models. The basic procedure of filtering is the same for voxel models, raster data and parameters. It is described here.
¶ Single sections
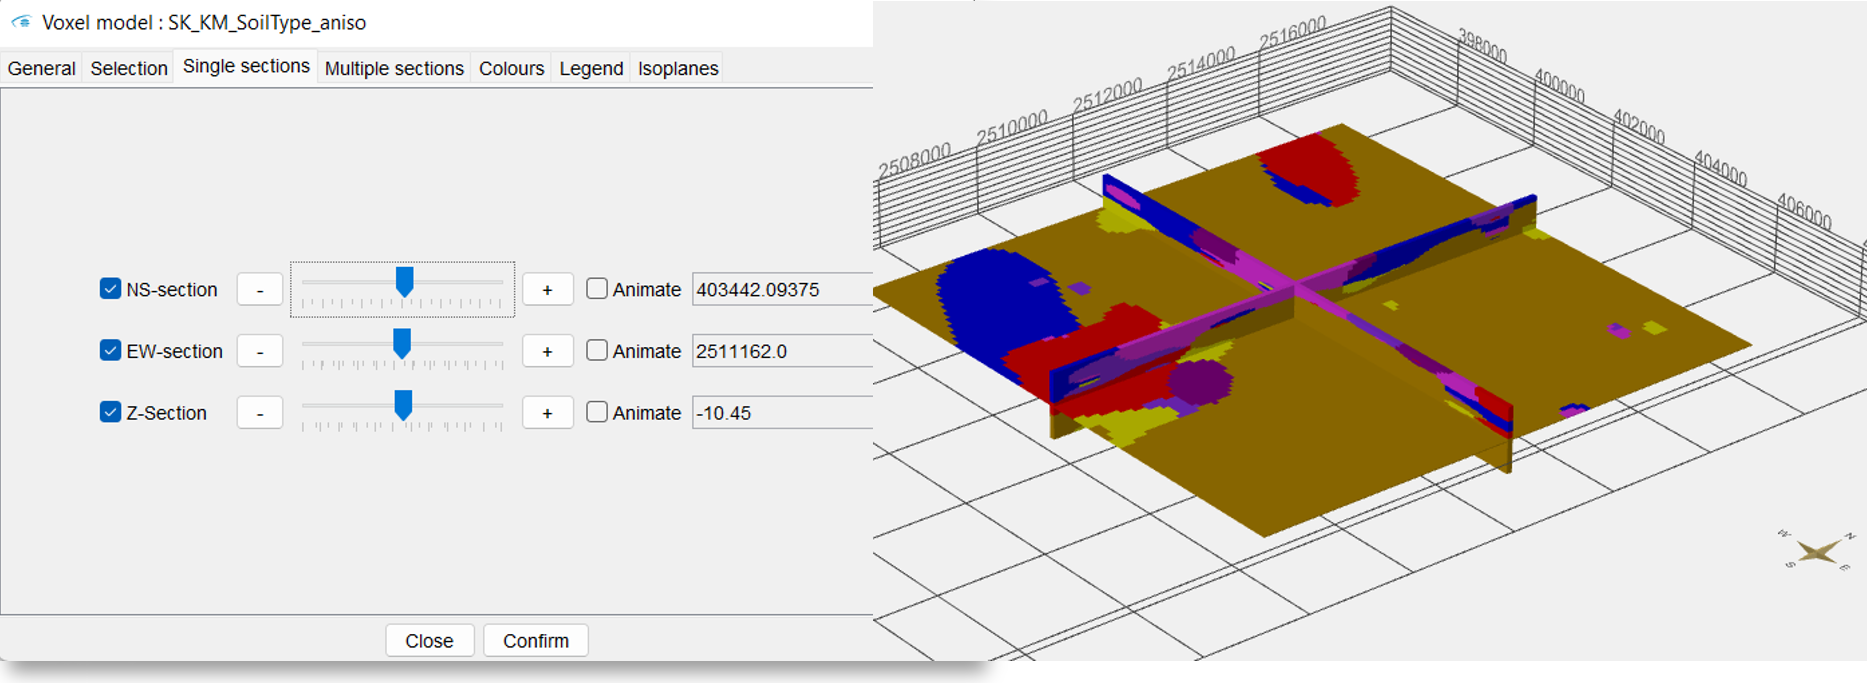
In the default settings, the sections are shown in the voxel model. In this menu you can show/hide the sections using the blue tick. NS-section are going north and south and EW-section are going east to west. Both can be moved along the x- and y-axis. The Z-section is a cross-sectional area that can be moved along the z-axis from top to bottom.
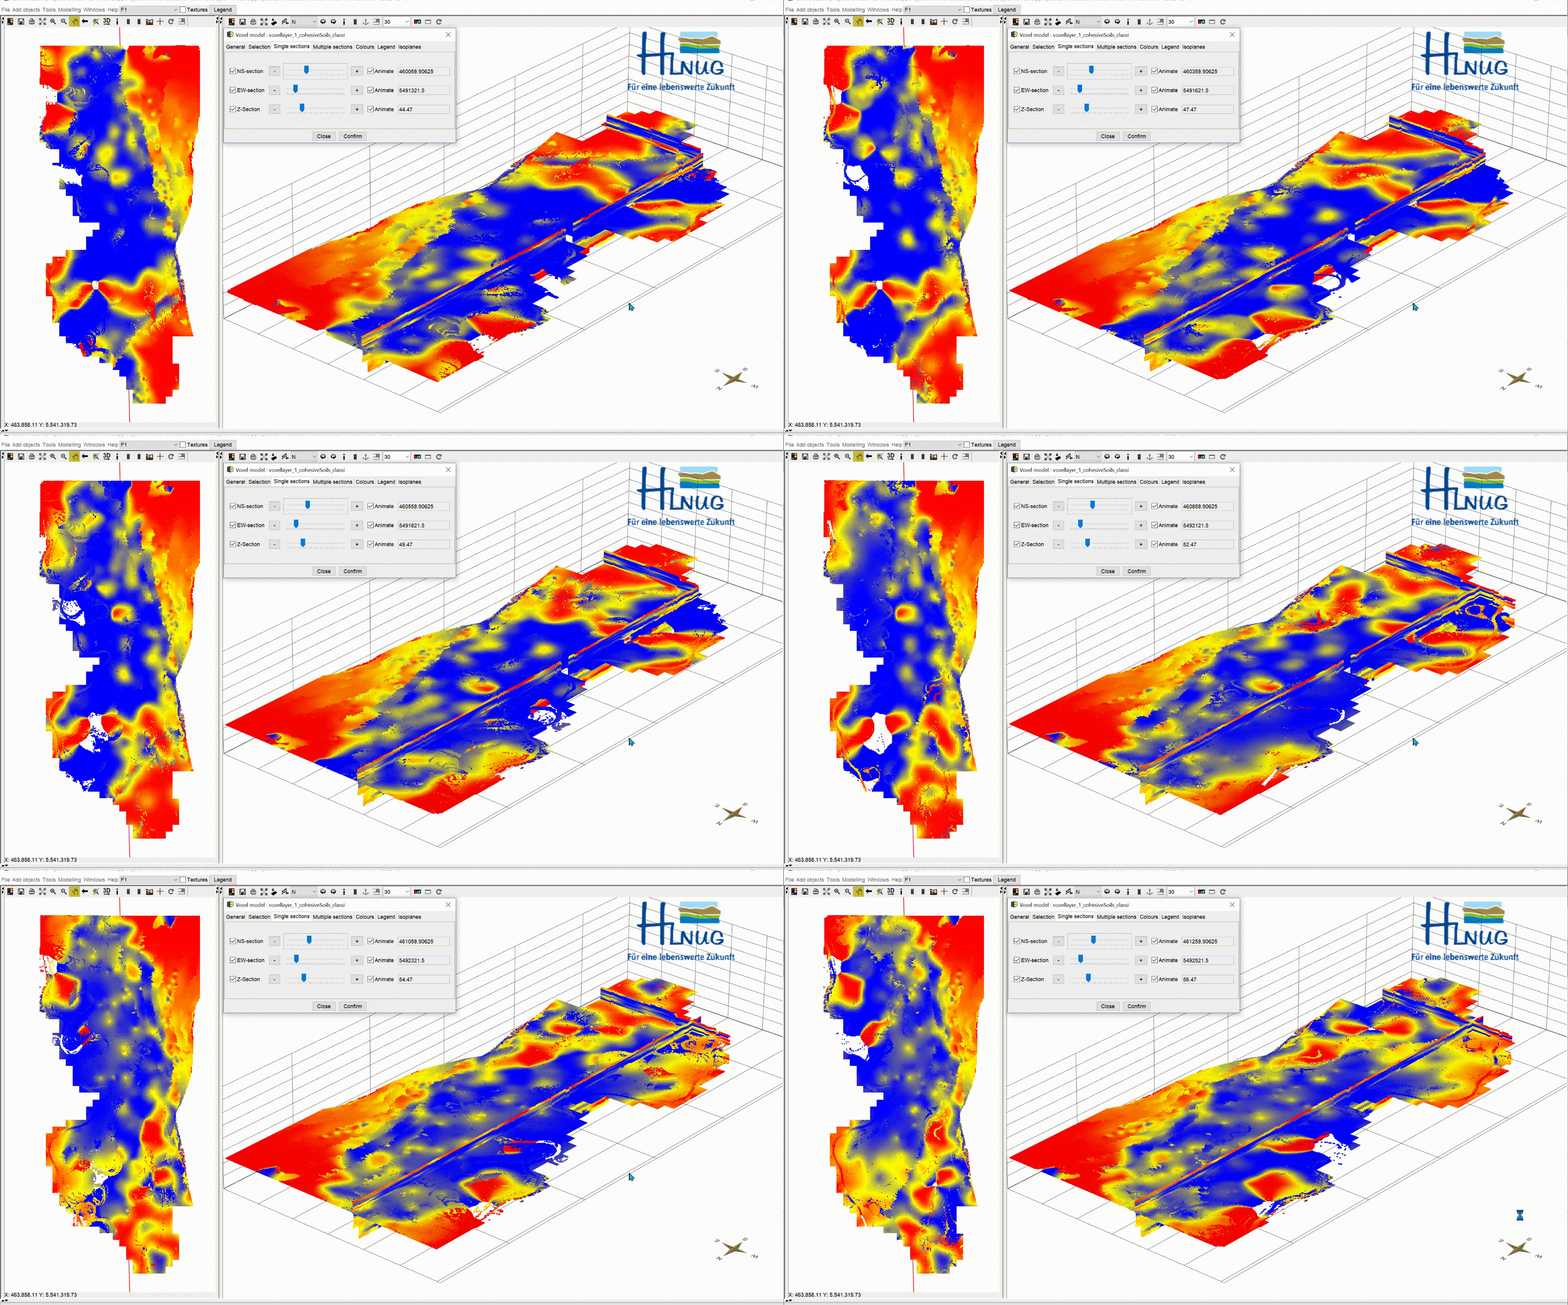
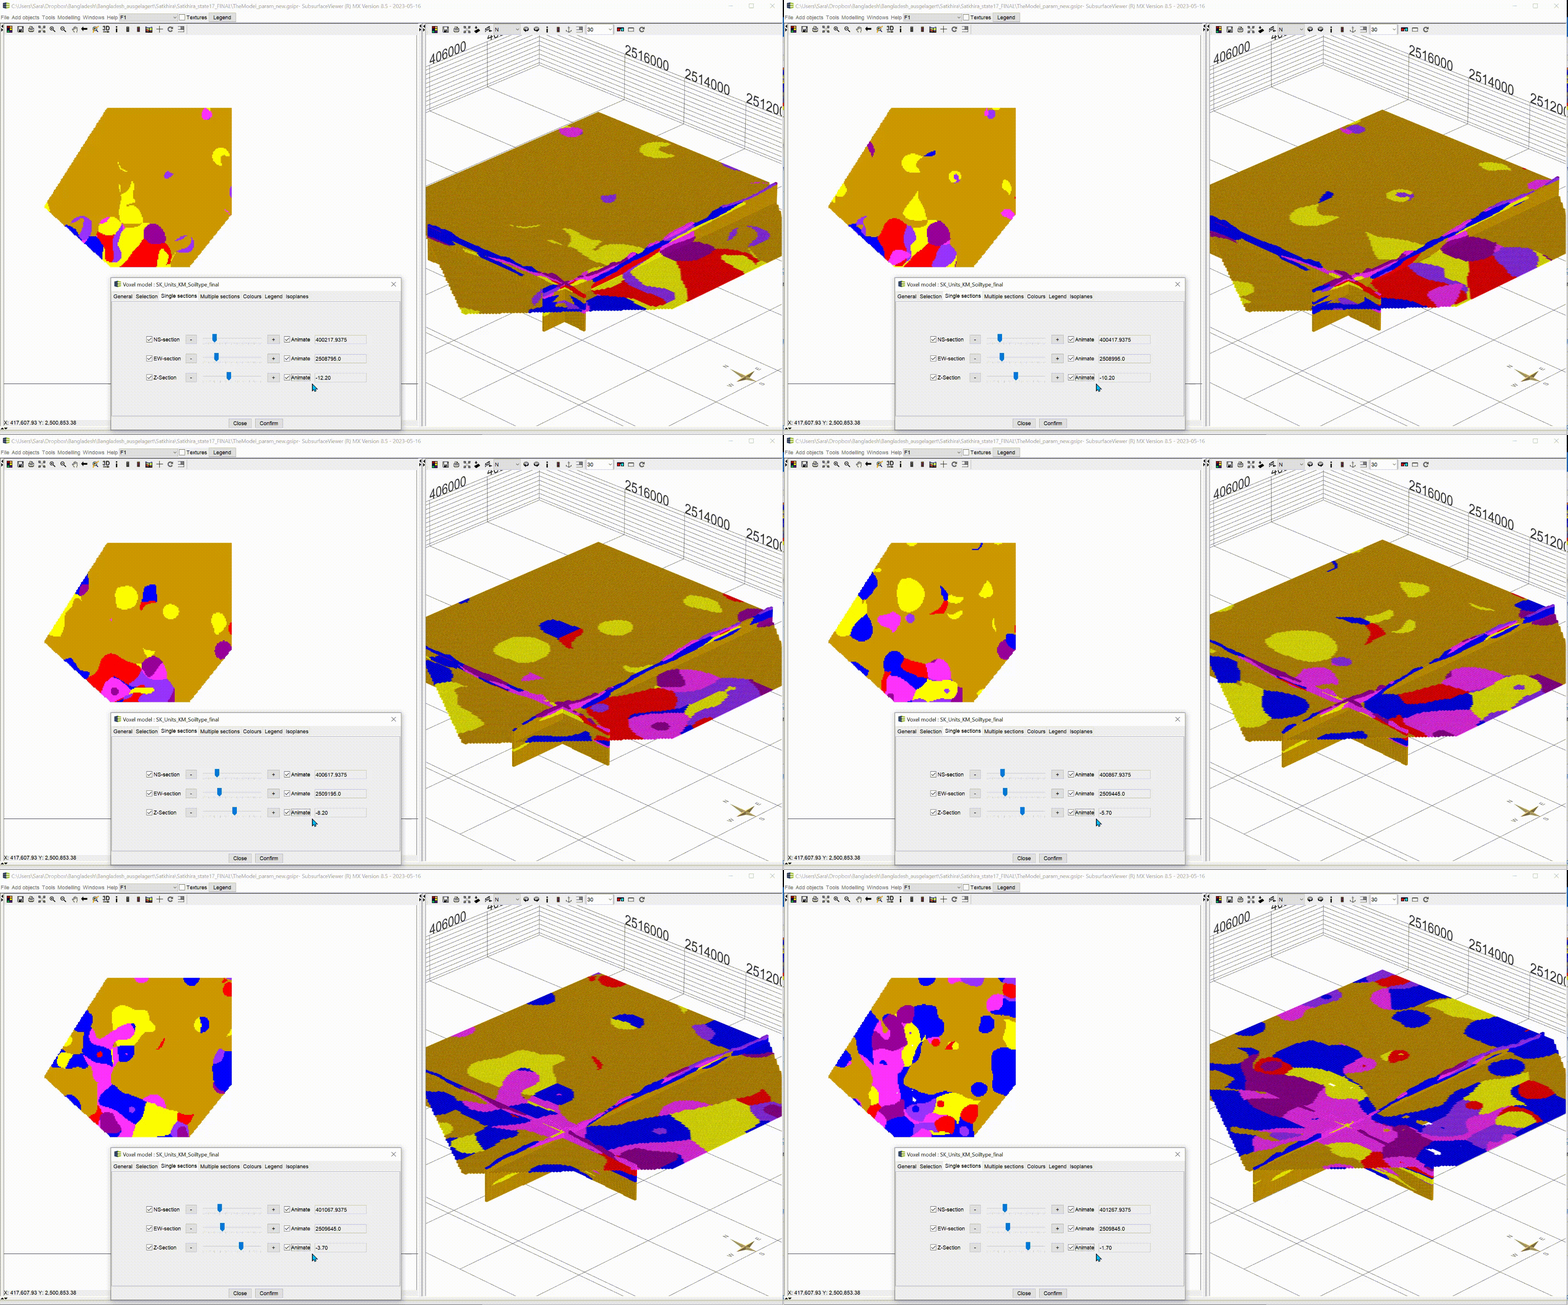
With the box Animate you have the possibility to have the planes animated automatically. This function can be used, to record videos. For more information, see Record Video. Let the animation run and look at the change of your parameter along the three axes, analyse it and interpret it for your application. A question could be where you can expect significantly groundwater inhibiting layers.
| 3D-NORG | Satkhira |
|---|---|
 |
 |
¶ Multiple sections
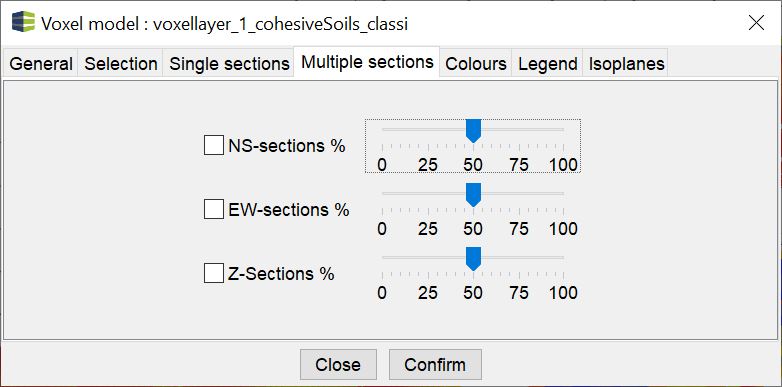
With Multiple sections, several sections can be displayed at the same time. This allows you to create fence diagrams (fence diagram). The number of sections along each axis can be adjusted using the sliders.
Note:
The settings must be Confirmed. A preview is usually provided. To move the multiple sections, the state must be confirmed so that the process is carried out.
¶ Colors
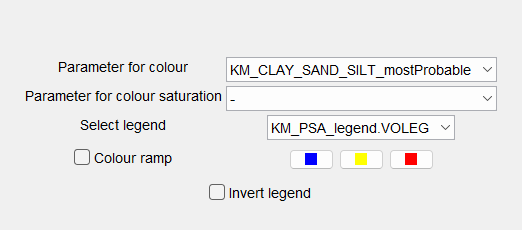
Under Colors you select the parameter from the voxel model that is to be displayed and the colours for it.
With Colour ramp and the assignment of the three-colour palette, you can define a colouring without defining your own legend. The colour palette always assigns the left colour value to the smallest parameter value, the middle colour value to the middle parameter value and the right colour value to the parameter maximum. With Invert legend the order of colour assignment is reversed.
You can set an existing legend under Select legend. If you want to create a legend, you can do so with the Legend Editor.
¶ Legend
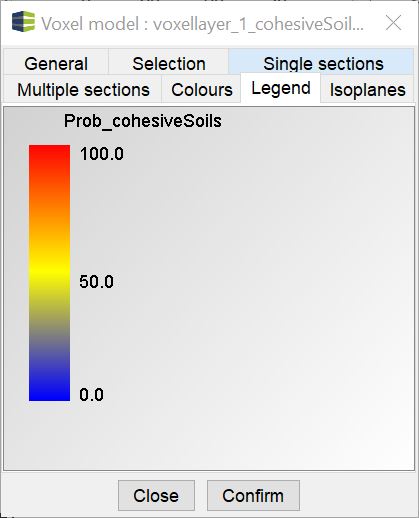
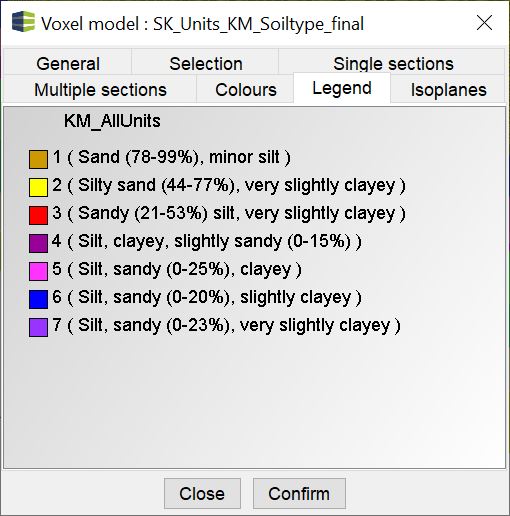
In this tab you see an image of your legend for overview. You have set these in the Colors tab.
| 3D-NORG | Satkhira |
|---|---|
 |
 |
¶ Isoplanes
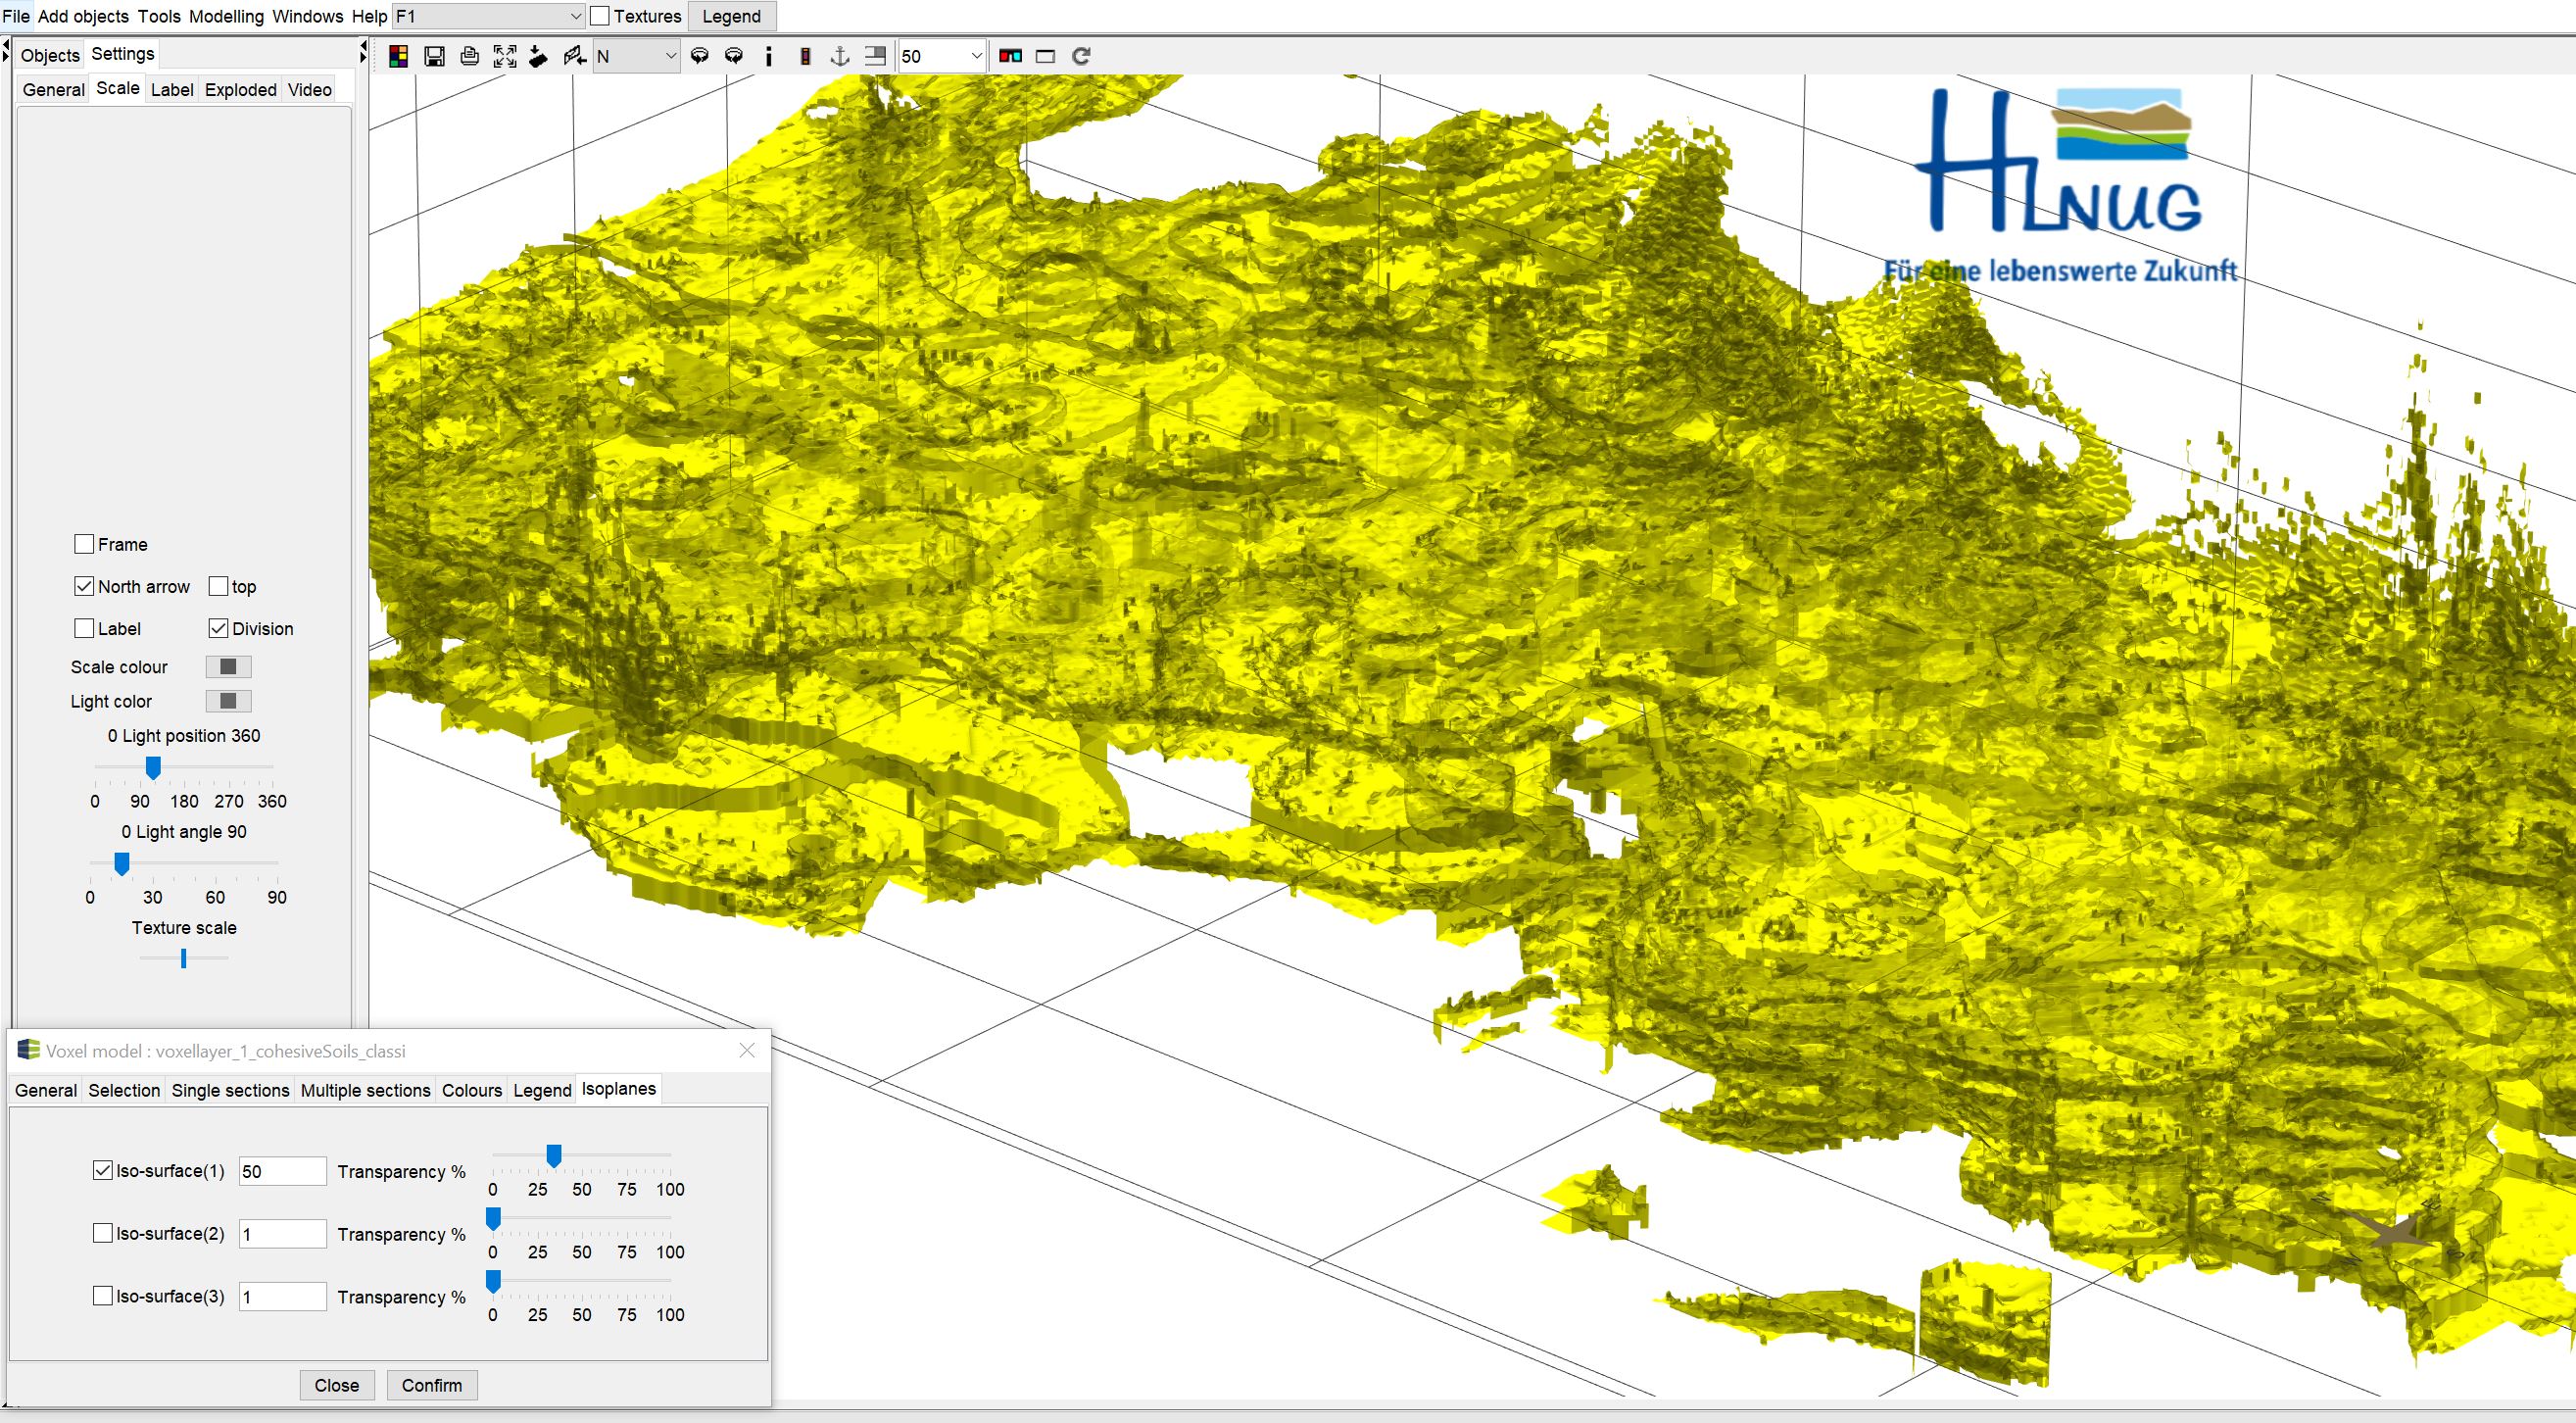
With the function Isoplanes, up to three isosurfaces, i.e. enclosing isosurfaces, can be calculated on a limit value of a parameter. These enclose the voxels whose values fall below the set limit value in the text field. Use the Transparency slider to set the transparency of the surfaces.
¶ Calculate
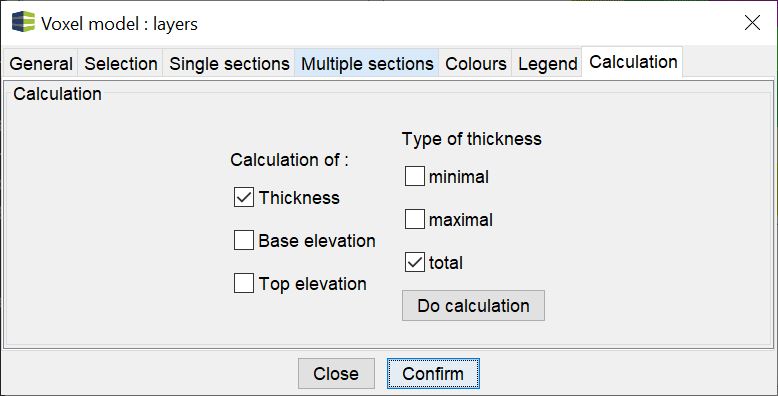
Here you can extract interfaces and thicknesses from an irregular voxel as Raster. The tab is not available for regular voxel models. If you want to extract from these surfaces, follow these instructions.
Select the checkmarks for the extractions as you need them and then press Do calculation.