By structural maps we mean isoline or isopachie maps of specific surfaces. Since we model geological layers over their base surfaces, we therefore use the line maps of the layer base edges.
To create models with structural maps, you need ... :
- ... a GVS-file and a projektlegend,
- ... an active DTM,
- ... Geometry2D-objects with contour lines/isopach,
- ... created empty layer-objects.
The best option is to model with structure maps in chronostratigraphic order from young to old
Note:
If you are working with structure maps for deeper layers, you can combine Profile Section Constructions. You must use contour maps for this.This modelling method is excellent for 3D mapping of shallow cover layers or sediments along river courses. Here you can also make good use of isopache plans.
Note: Profile contents for a layer that is otherwise calculated via isopaches cannot be considered! The combination of structure map and profile sections only works with isolines.
Furthermore:
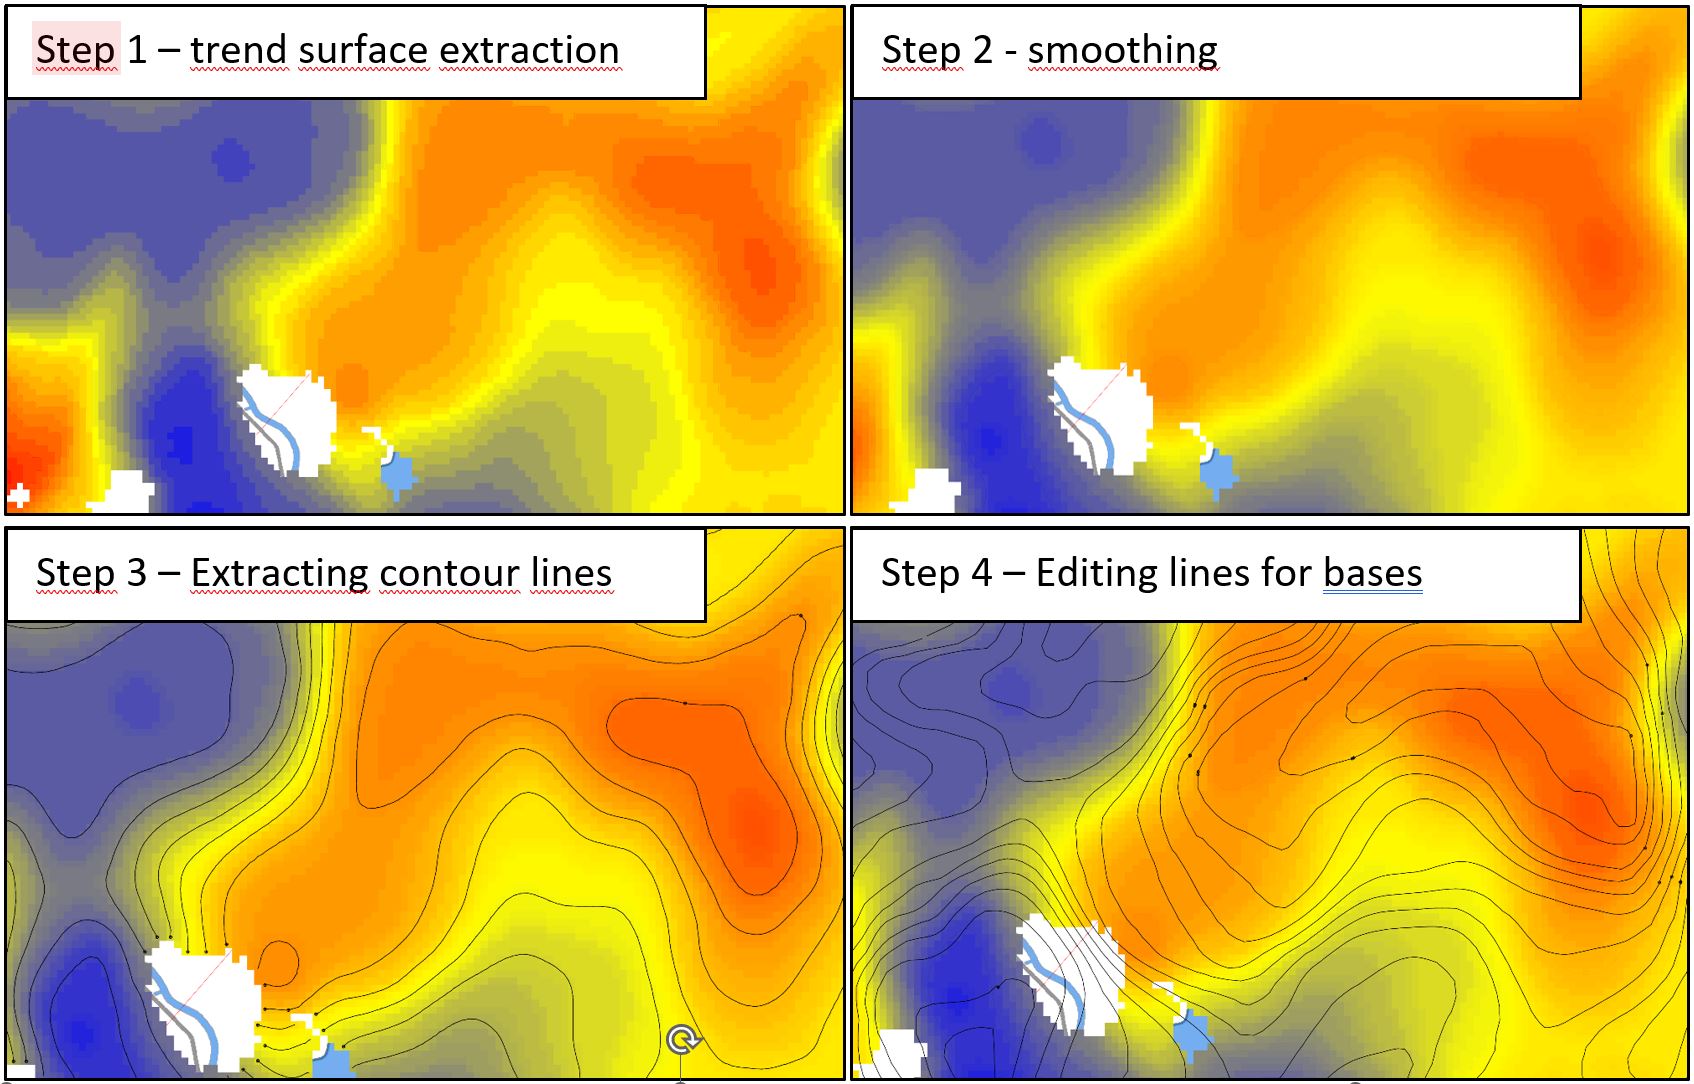
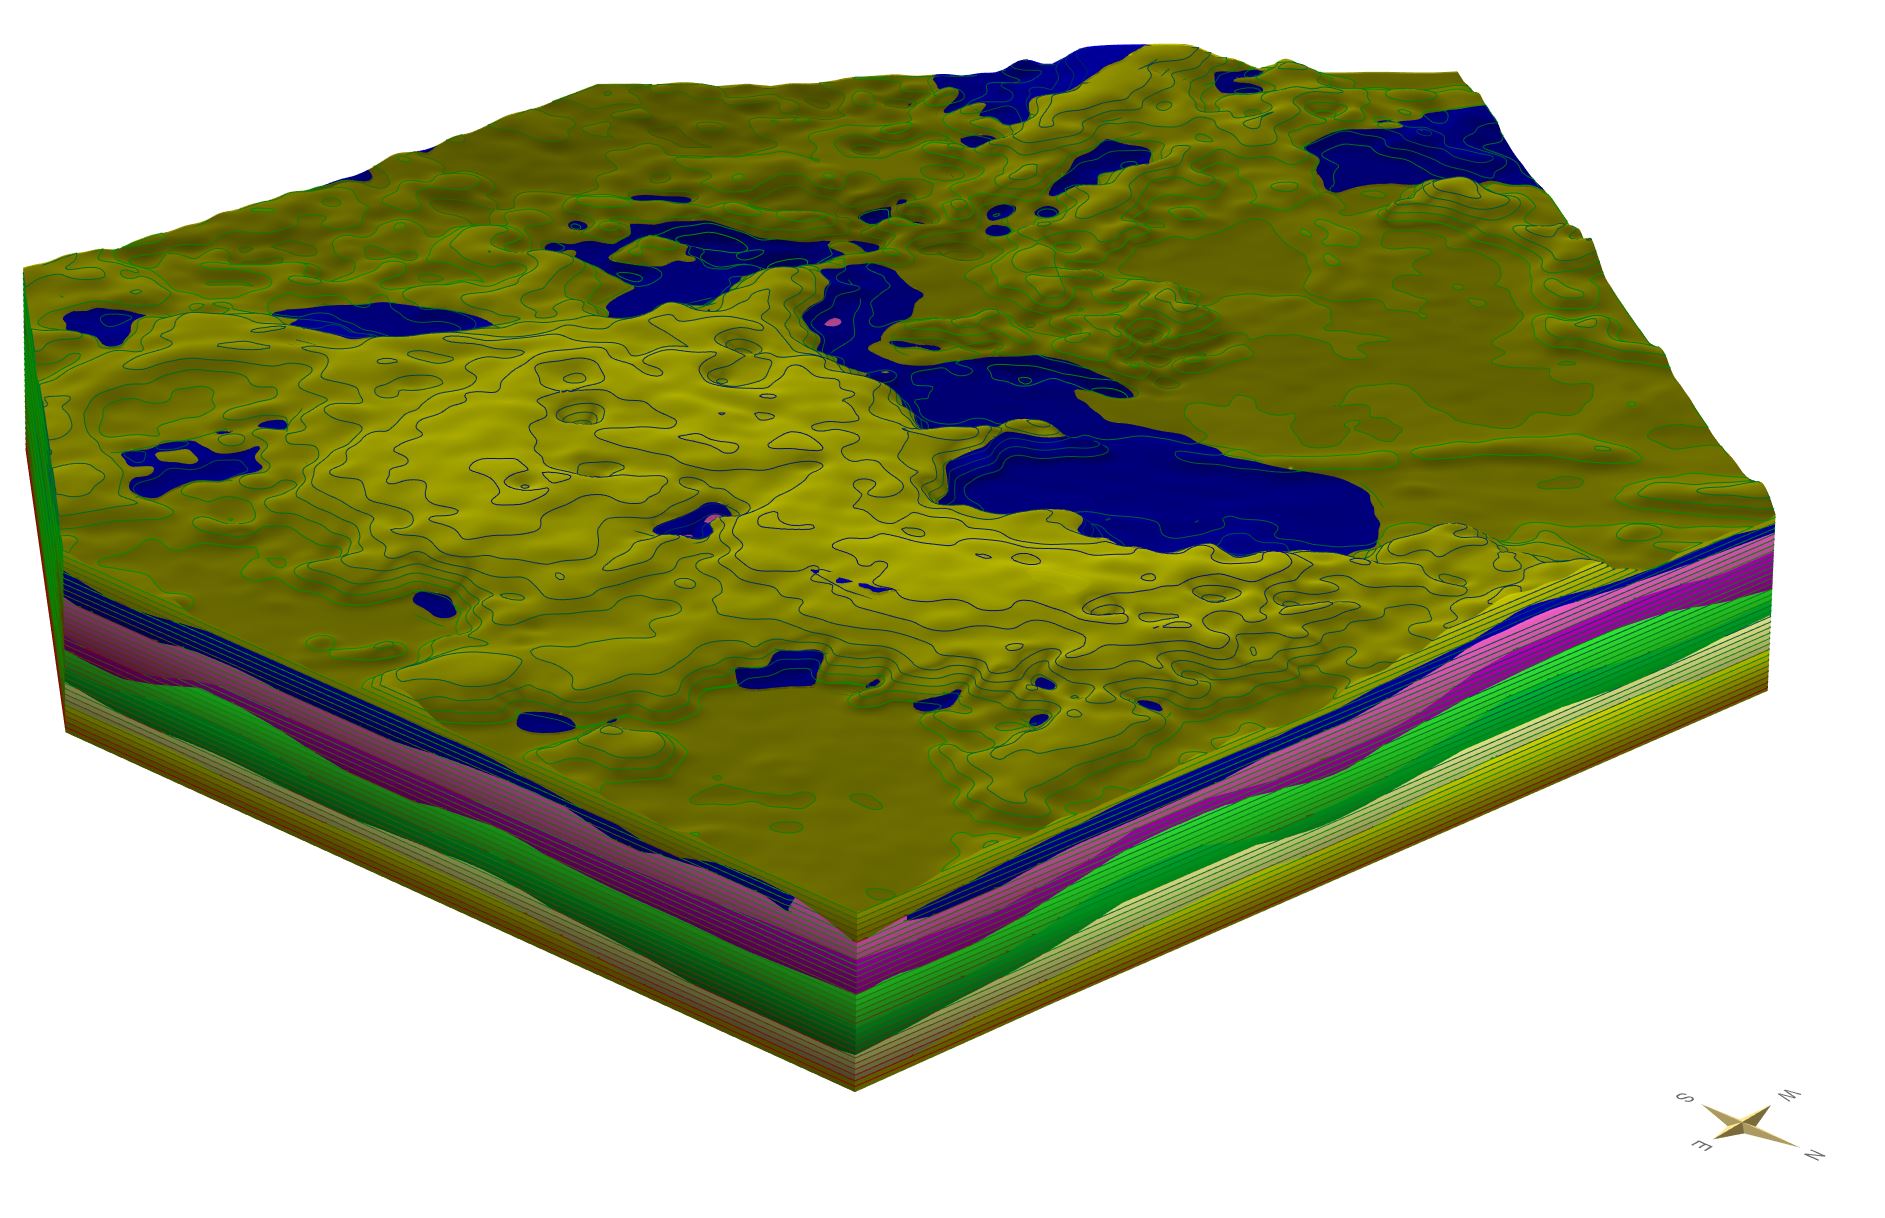
The layer model Satkhira, which used in the wiki to illustrate the functions, was created entirely with structure maps. A hybrid approach was chosen here: First, layer labels were created with LogExplorer, then interpolated with a categorical 3D-indicator-riging. Then, the voxels with the highest probability of occurrence were filtered and their base surfaces extracted. Aftewards these were smoothed, the contour lines copied into the buffer and copied into a geometry2D. They were revised and transferred to a layer calculation.
contour line editing result
Note:
You can also use structure maps from loaded line shapes.
- You load the line shape. The heights must be assigned to the line shape by an attribute, which was selected via the shape-settings.
- Select all lines with the attribute table and copy them into the clipboard.
- Now use the function paste from the context menu in the editable geometry2D object. Now you can link this object with a geological-layer and thus ...
4.... for the calculation.
¶ linetypes
When you create lines in the geometry2D object, they must be assigned an absolute height or an isopachen value (thickness) by name. To do this, use the right-click context menu of the lines in the 2D view for an object that is enabled for editing. Please also read the linked article on geometry2D.
You can generate three different line types with the naming:
1. lines with simple heights or ispoachen values (contour lines/isopaches),
2. lines with a linear gradient between two values ("from to"-lines),
3. lines with the title crossline.
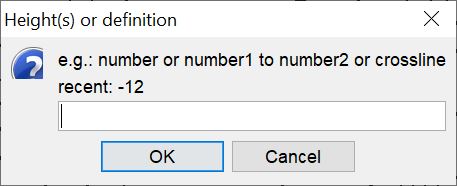 You will see a suggestion of the text to be entered in the title of the *Rename* dialogue.
For 1. e.g. "-12".
For 2. e.g. "10 to 12" or "12 to 10", depending on the orientation of the line.
For 3. e.g. "crossline".
Under recent you see the currently set value.
In the illustration is shown where the lines could be placed.
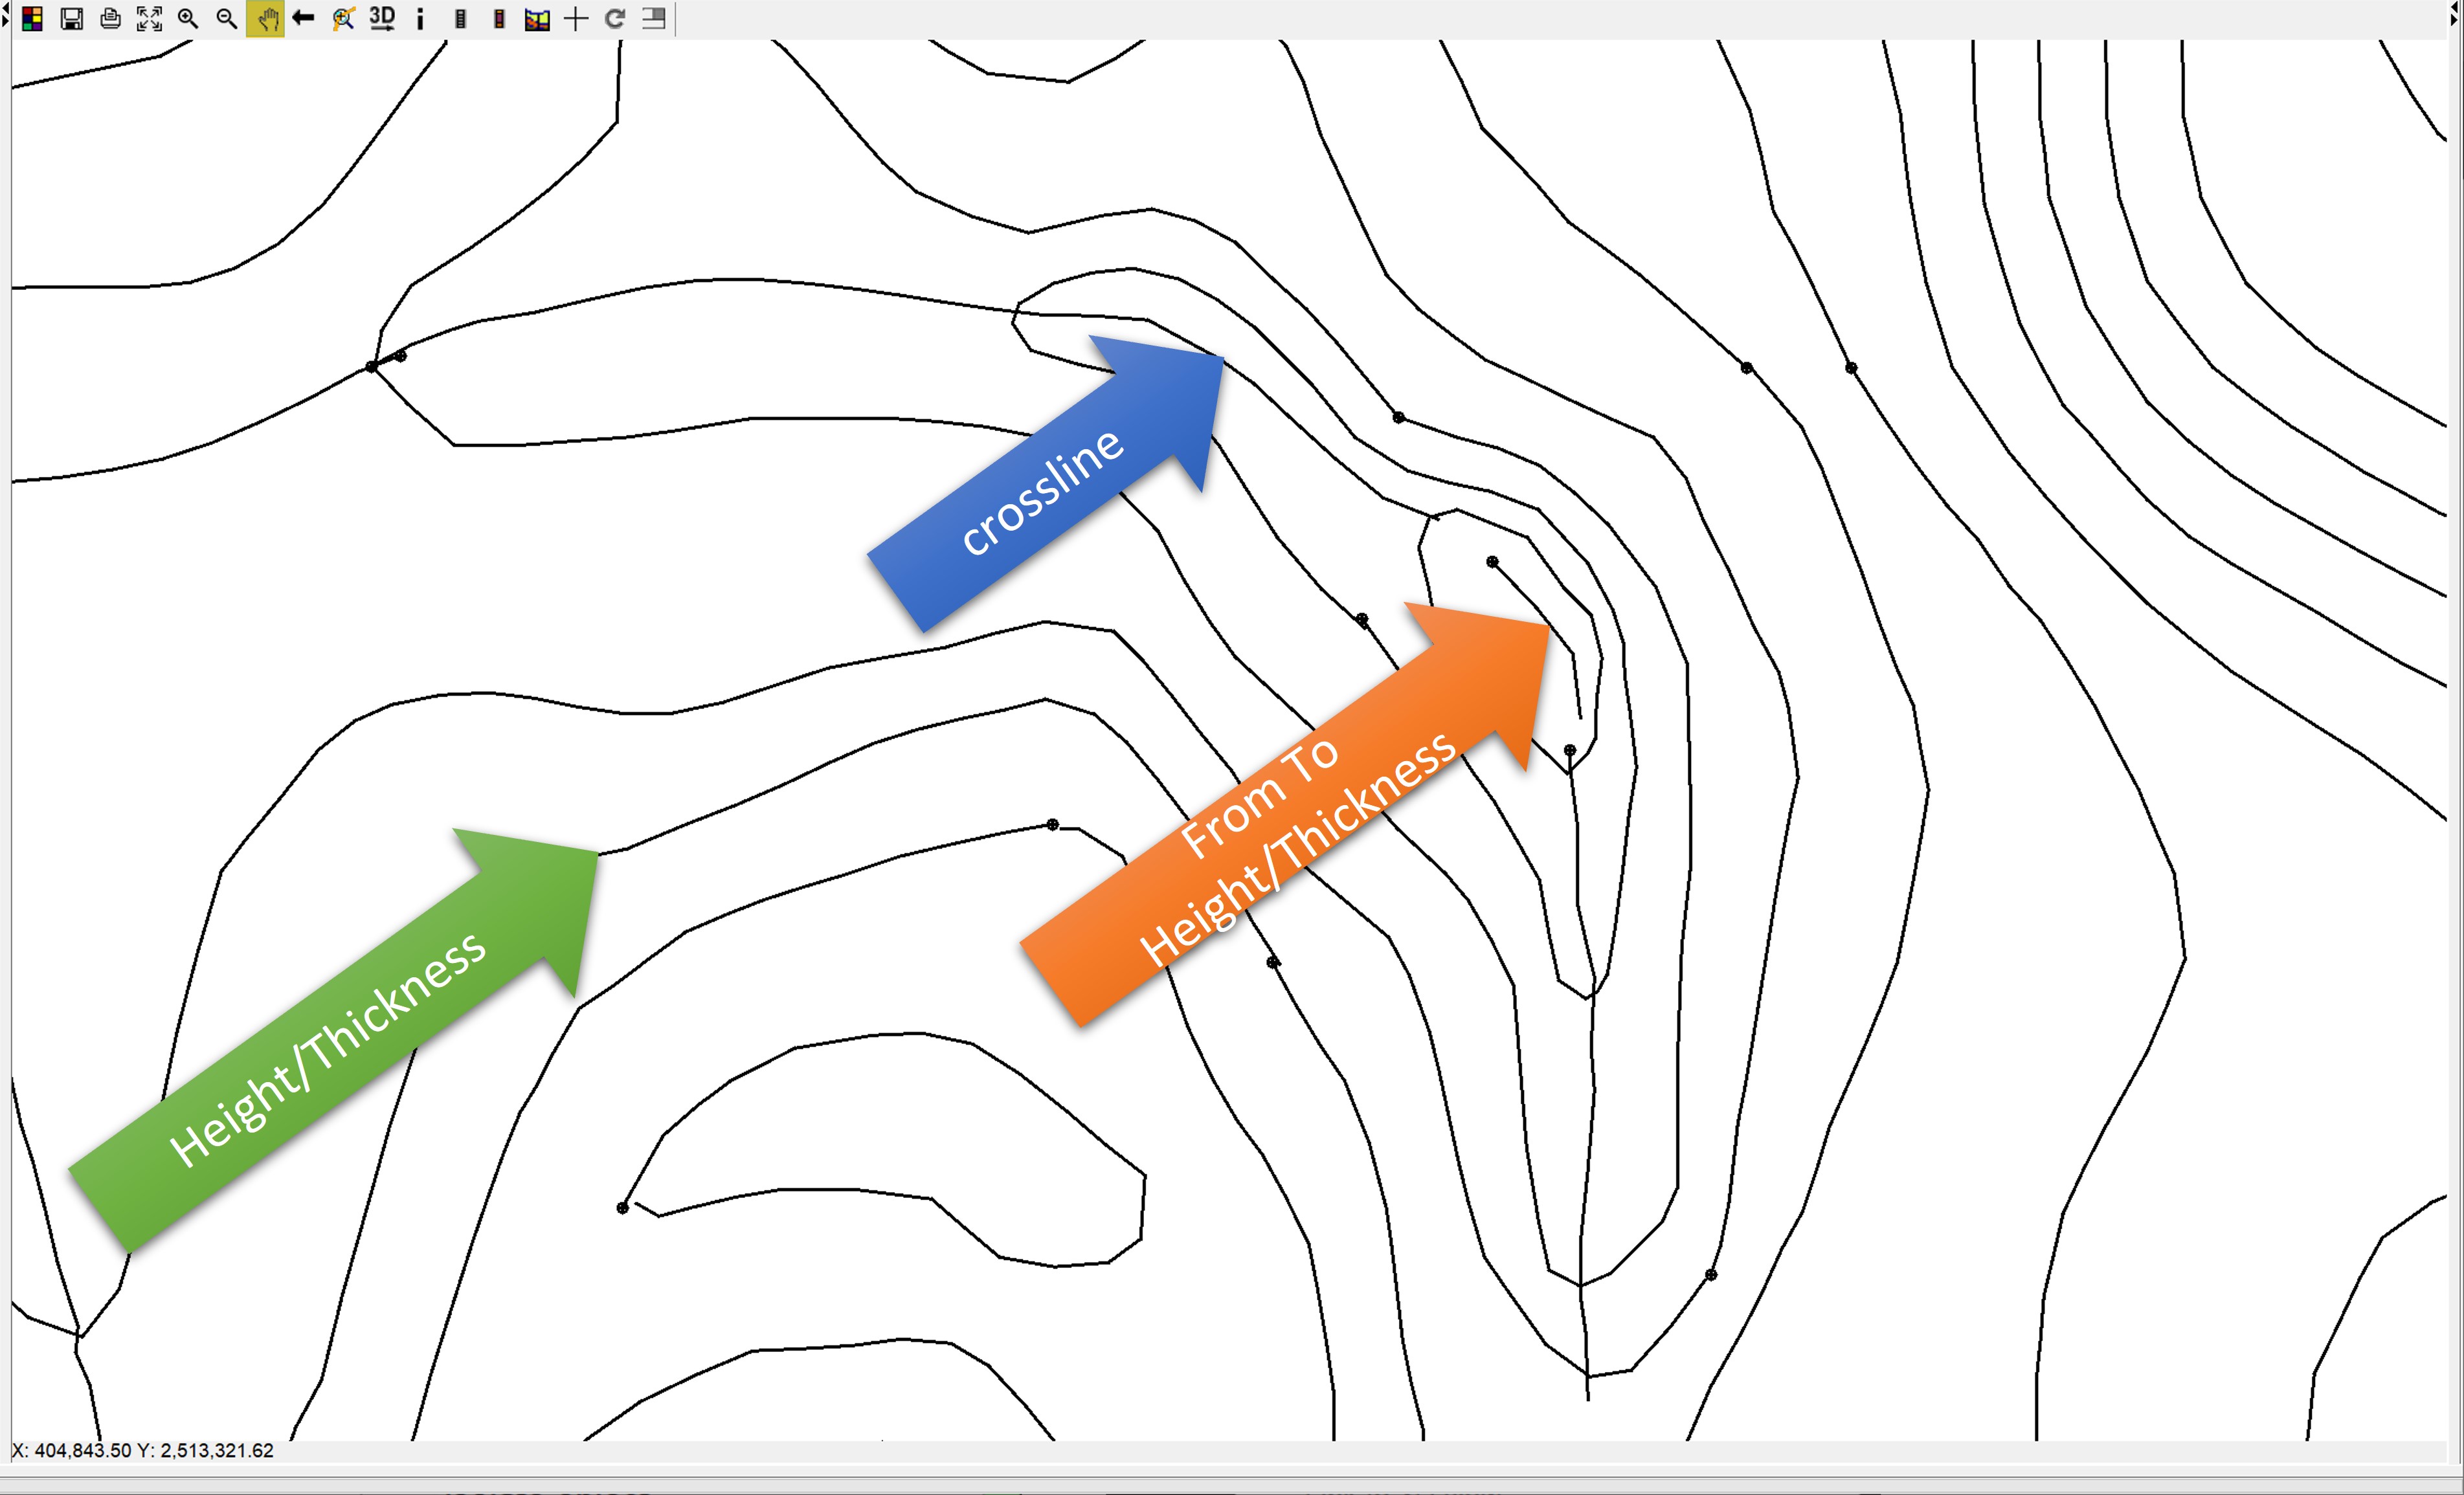
- contoured lines and isopaches represent the basic structure of the area as well as the georeferencing.
- "From to" lines can be helpful, if you want to model linearly from one elevation to the next contour lines.
- "crosslines" are very similar to the "from to" lines. Here the linear interpolation between the intersections of this line with the isolines/isopachs is done. The line receives the heights at the intersected section of the crossing contour line/isopaches. They can be used to enhance "ridge" or "valley" structures and avoid flat interpolation between tapering isolines.
Note: The interpolation is a triangulation. This uses only the nodes of the lines! You may already know this from the calculation of models using the correlation lines from profile sections. It is important that the nodes on the strucur lines are not too dense, because otherwise very tapered triangles will result, which can be unfavourable for a surface structure. The node density should also be considered when using type 2. and 3. lines.
Note: Use the functions populate lines, smooth lines and depopulate lines to optimise the node density. Read the notes on the Geometry2D object.
¶ Structure maps with layer outcrops
If you have layer outcrops, you need to be careful about the edges when constructing contour lines/isopachs to create plausible surfaces. This is because the nodes of the boundary polygons of the layer are given the height of the lower edges of the layers above or the DTM if there is nothing above. To avoid steep walls or triangular peaks, you should adjust the contour lines according to the boundary heights. We have included a little help for this.
In the example we have cut a "hole" in the layer spread, to explain the function to you. You must have assigned the geometry2D object to a geological layer for this function. How to do that is explained further below.
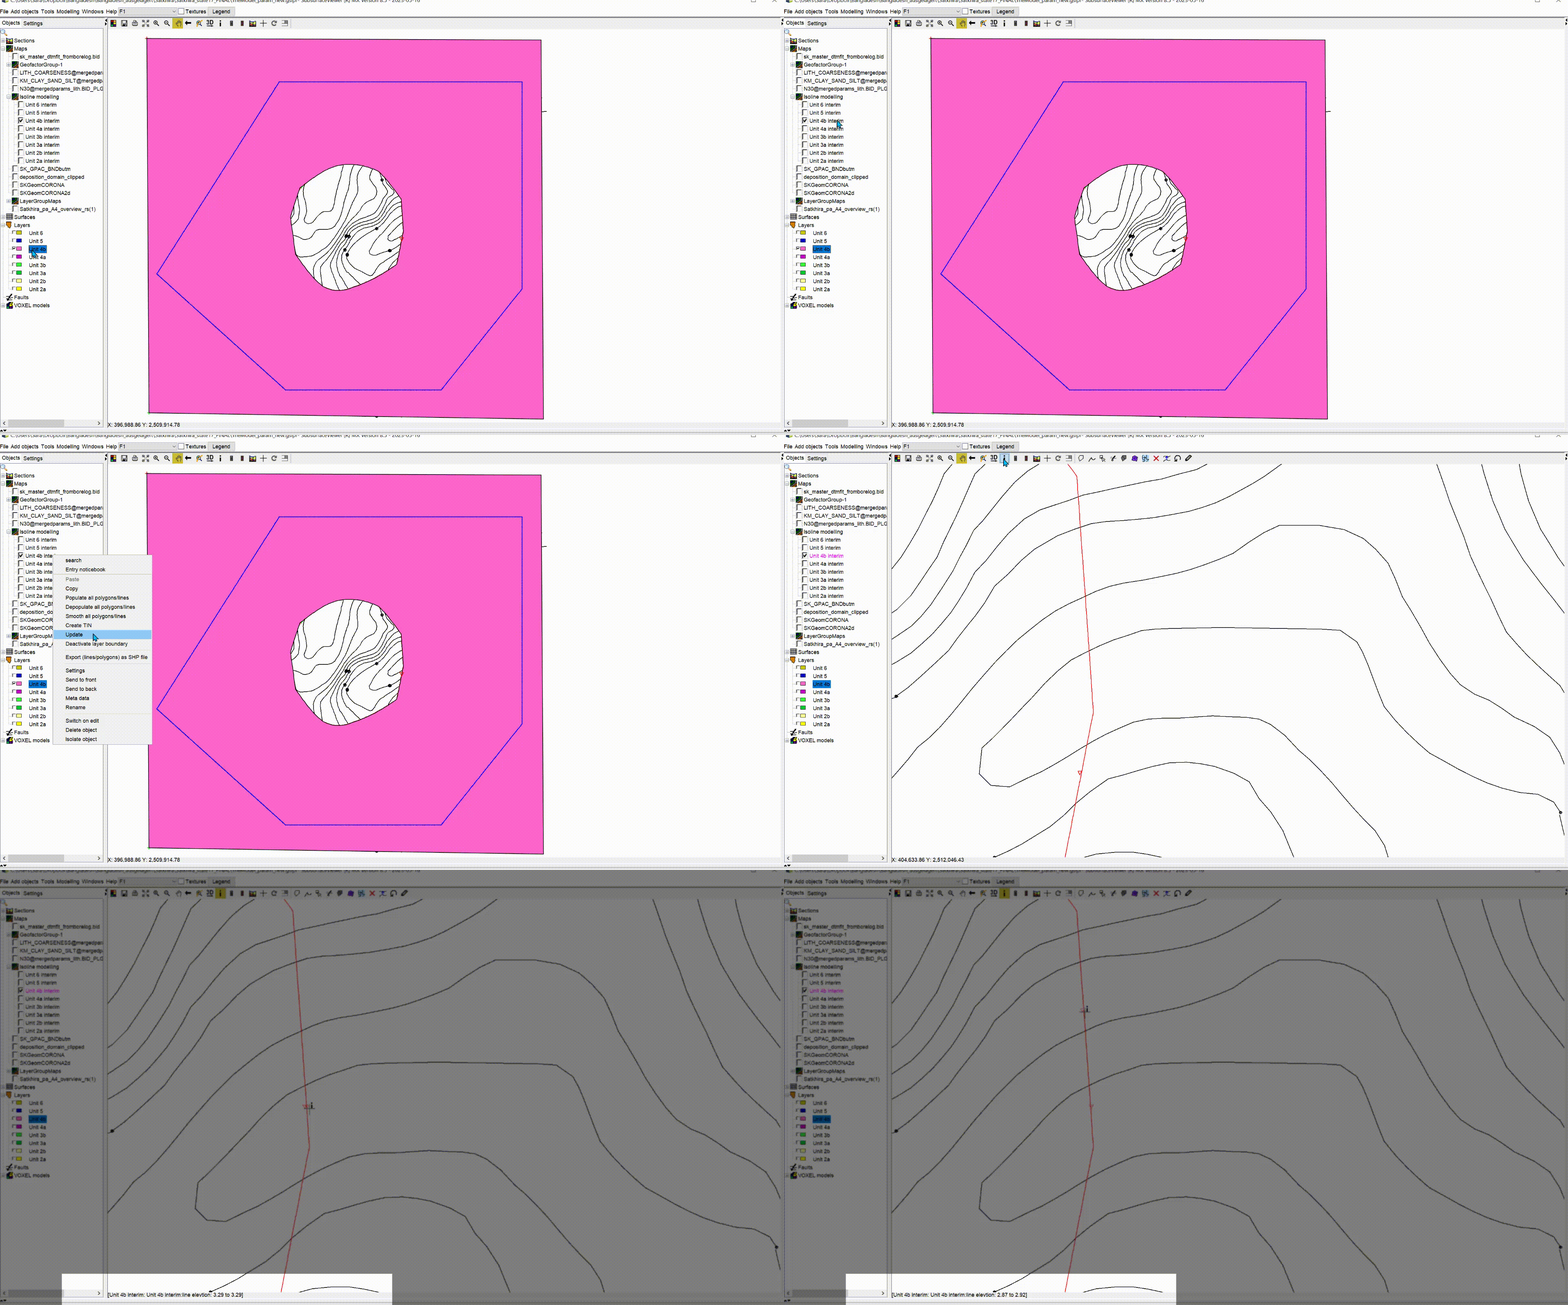
- go to the right-click context menu of the geometry2D object and use the function update. A red line will be created in the object. You can set the colour of the line in the geometry2D settings.
- You switch on your Geometry2D object that belongs to the layer for editing.
- If you click on this line in the 2D-View, you will see in the window below the heights that are on the nodes of the outer boundary. If you click between two nodes of this outline you will get a "from"-"to" indication with the heights of the two nodes left and right (top/bottom).
Note: In order for the function to show you the correct heights, you must have modelled and calculated all the lower edges of the layers above, unless you are dealing with the youngest layer. Then the DTM is sufficient.
¶ Calculation of the geological layer
When you have completed a structure map, you can see the result in the layer calculation.
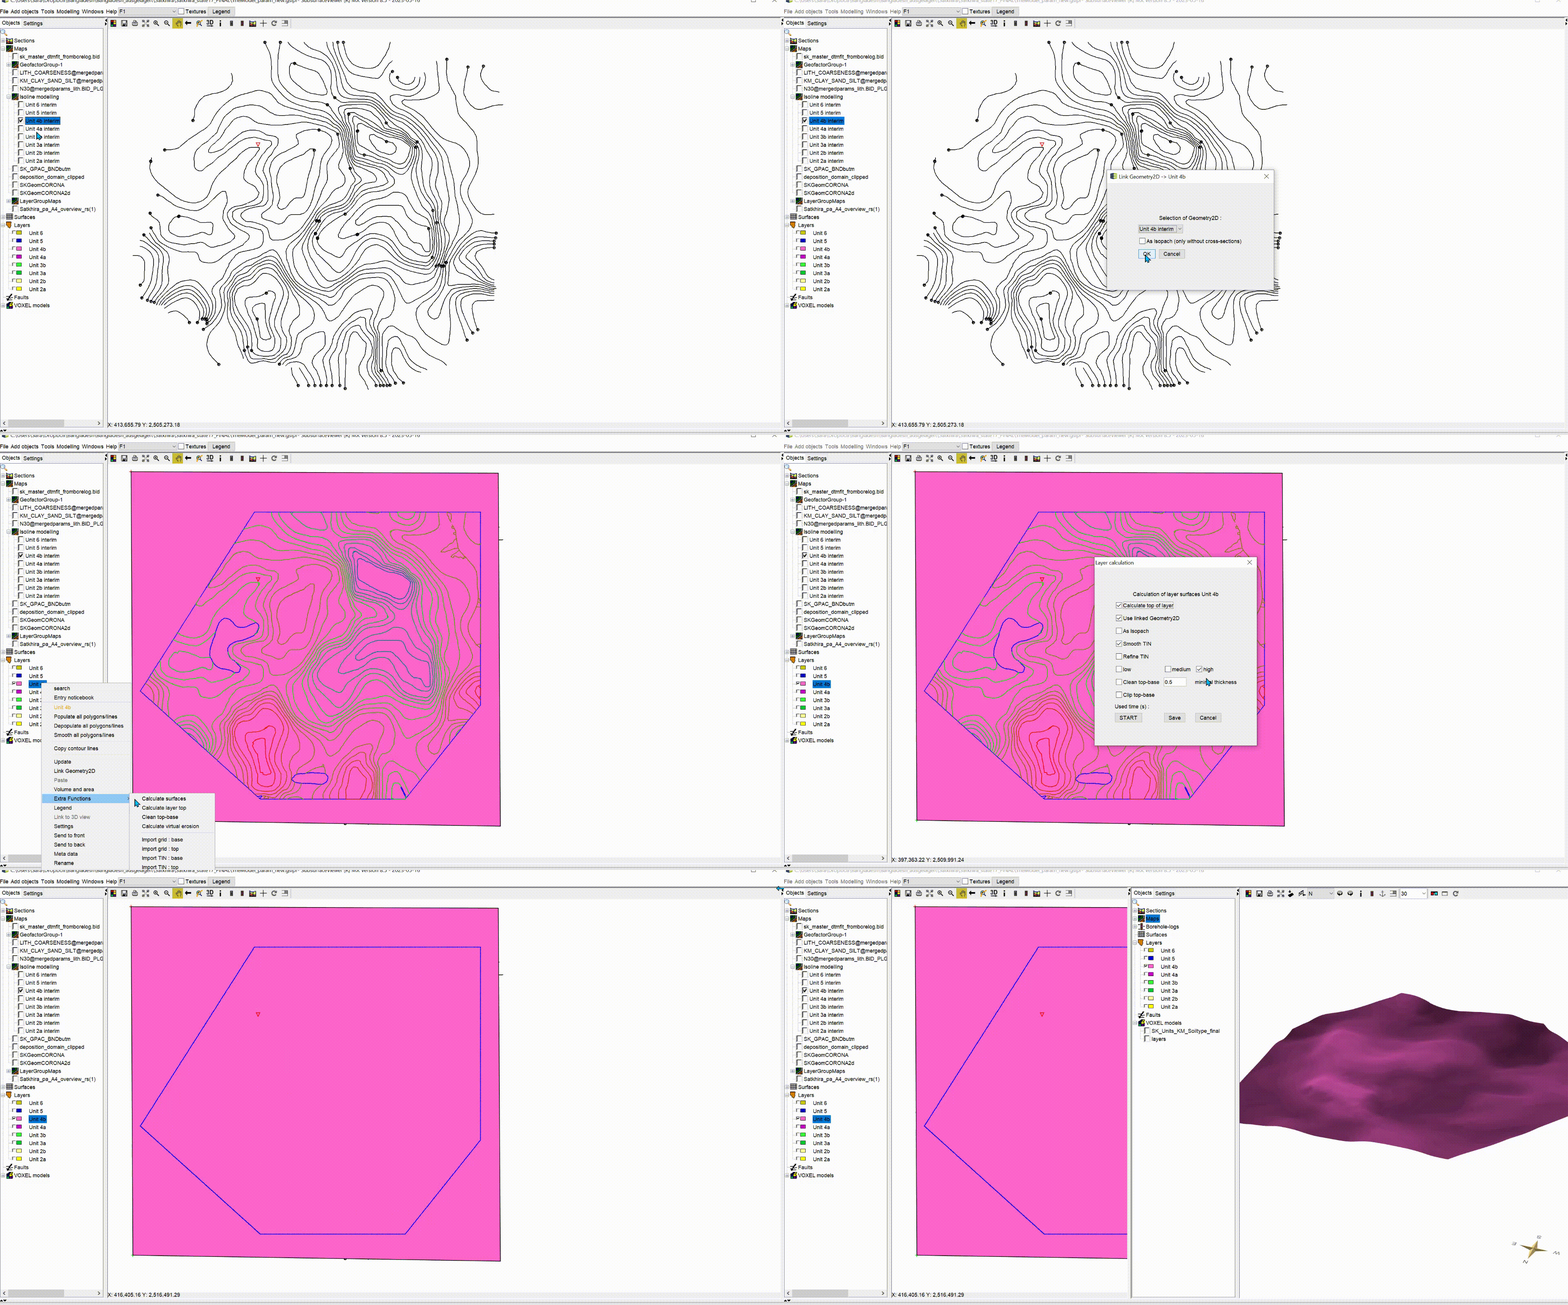
-
To do this, open the right-click context menu of the geological layer to which you want to assign this structure map. Use the option link to geometry2D. A dialogue opens with the names of the Geometry2D objects in the system. Select the correct one and confirm with OK.
-
Open the right-click context menu of the geological layer again and select calculate layer under extra functions. A dialogue opens.
-
Check the box use linked geometry2D. If you have constructed isopaches, also check as isopach. Optionally, set Smoothing, e.g. as medium. This improves the TIN structure considerably. Have a look at the article triangulations. An example with TINs from structure maps is shown.
-
Calculate the layer, optionally also with surface, if you are doing the final layer calculation.
Succestion: If you have modelled thin or highly structured layers, we recommend calling the function virtual erosion for each individual layer. You must do this in chronostratigraphic order from young to old.
